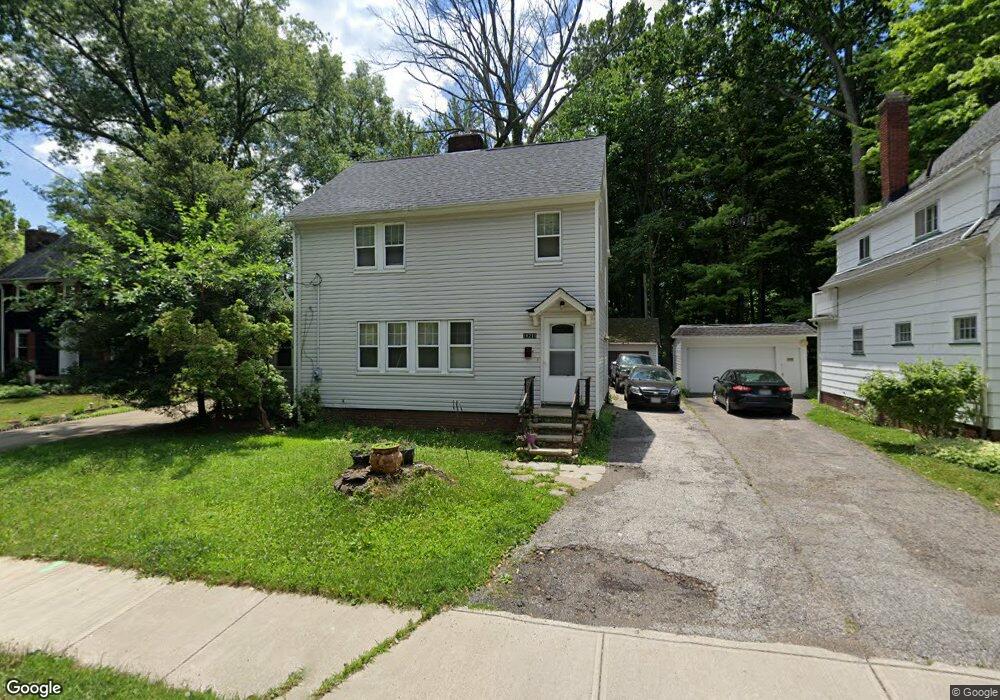
16210 Oakhill Rd Cleveland, OH 44112
Estimated Value: $128,050 - $203,000
3
Beds
2
Baths
1,424
Sq Ft
$120/Sq Ft
Est. Value
About This Home
This home is located at 16210 Oakhill Rd, Cleveland, OH 44112 and is currently estimated at $171,513, approximately $120 per square foot. 16210 Oakhill Rd is a home located in Cuyahoga County with nearby schools including Shaw High School, Apex Academy, and Yeshiva Derech Hatorah.
Ownership History
Date
Name
Owned For
Owner Type
Purchase Details
Closed on
Mar 23, 2017
Sold by
Crosby Gerald R
Bought by
Crosby John
Current Estimated Value
Purchase Details
Closed on
Dec 23, 1997
Sold by
Cresthaven Dev
Bought by
Crosby Sharon L
Home Financials for this Owner
Home Financials are based on the most recent Mortgage that was taken out on this home.
Original Mortgage
$79,550
Outstanding Balance
$13,613
Interest Rate
7.36%
Mortgage Type
New Conventional
Estimated Equity
$157,900
Purchase Details
Closed on
Oct 7, 1996
Sold by
Sheriff Of Cuyahoga Coun
Bought by
Federal Nationwide Mtg Assoc
Purchase Details
Closed on
Mar 30, 1979
Bought by
Denise E Mack
Purchase Details
Closed on
Mar 10, 1977
Sold by
Tokarsky Fred R and Tokarsky Frances M
Bought by
Haynes Leonard Glenn
Purchase Details
Closed on
Jan 1, 1975
Bought by
Tokarsky Fred R and Tokarsky Frances M
Create a Home Valuation Report for This Property
The Home Valuation Report is an in-depth analysis detailing your home's value as well as a comparison with similar homes in the area
Home Values in the Area
Average Home Value in this Area
Purchase History
| Date | Buyer | Sale Price | Title Company |
|---|---|---|---|
| Crosby John | -- | None Available | |
| Crosby John | -- | None Available | |
| Crosby Sharon L | $80,000 | -- | |
| Federal Nationwide Mtg Assoc | $43,334 | -- | |
| Denise E Mack | $46,000 | -- | |
| Diamond Shamrock Corp | -- | -- | |
| Haynes Leonard Glenn | $34,500 | -- | |
| Tokarsky Fred R | -- | -- |
Source: Public Records
Mortgage History
| Date | Status | Borrower | Loan Amount |
|---|---|---|---|
| Open | Crosby Sharon L | $79,550 |
Source: Public Records
Tax History Compared to Growth
Tax History
| Year | Tax Paid | Tax Assessment Tax Assessment Total Assessment is a certain percentage of the fair market value that is determined by local assessors to be the total taxable value of land and additions on the property. | Land | Improvement |
|---|---|---|---|---|
| 2024 | $1,768 | $27,125 | $5,005 | $22,120 |
| 2023 | $2,183 | $16,770 | $2,490 | $14,280 |
| 2022 | $1,582 | $16,765 | $2,485 | $14,280 |
| 2021 | $1,569 | $16,770 | $2,490 | $14,280 |
| 2020 | $1,714 | $17,080 | $2,520 | $14,560 |
| 2019 | $1,790 | $48,800 | $7,200 | $41,600 |
| 2018 | $1,885 | $17,080 | $2,520 | $14,560 |
| 2017 | $2,006 | $20,970 | $3,820 | $17,150 |
| 2016 | $1,991 | $20,970 | $3,820 | $17,150 |
| 2015 | $2,139 | $20,970 | $3,820 | $17,150 |
| 2014 | $2,139 | $24,680 | $4,480 | $20,200 |
Source: Public Records
Map
Nearby Homes
- 16215 Oakhill Rd
- 15908 Hazel Rd
- 16263 Oakhill Rd
- 15959 Glynn Rd
- 15720 Hazel Rd
- 2137 N Taylor Rd
- 2188 N Taylor Rd
- 15703 Hazel Rd
- 2195 N Taylor Rd
- 2067 Mount Vernon Blvd
- 936 Dresden Rd
- 1012 Helmsdale Rd
- 955 Dresden Rd
- 945 Dresden Rd
- 1081 Carver Rd
- 2257 N Taylor Rd
- 991 Helmsdale Rd
- 1107 Brandon Rd
- 1073 Hereford Rd
- 1061 Greyton Rd
- 16204 Oakhill Rd
- 16214 Oakhill Rd
- 16211 Oakhill Rd
- 16205 Oakhill Rd
- 16141 Glynn Rd
- 16201 Oakhill Rd
- 16221 Oakhill Rd
- 16230 Oakhill Rd
- 16119 Oakhill Rd
- 16111 Oakhill Rd
- 16016 Hazel Rd
- 16157 Glynn Rd
- 16201 Glynn Rd
- 16085 Glynn Rd
- 16173 Glynn Rd
- 16225 Glynn Rd
- 16225 Glynn Rd Unit ID1057689P
- 16065 Glynn Rd
- 16105 Oakhill Rd
- 16006 Hazel Rd