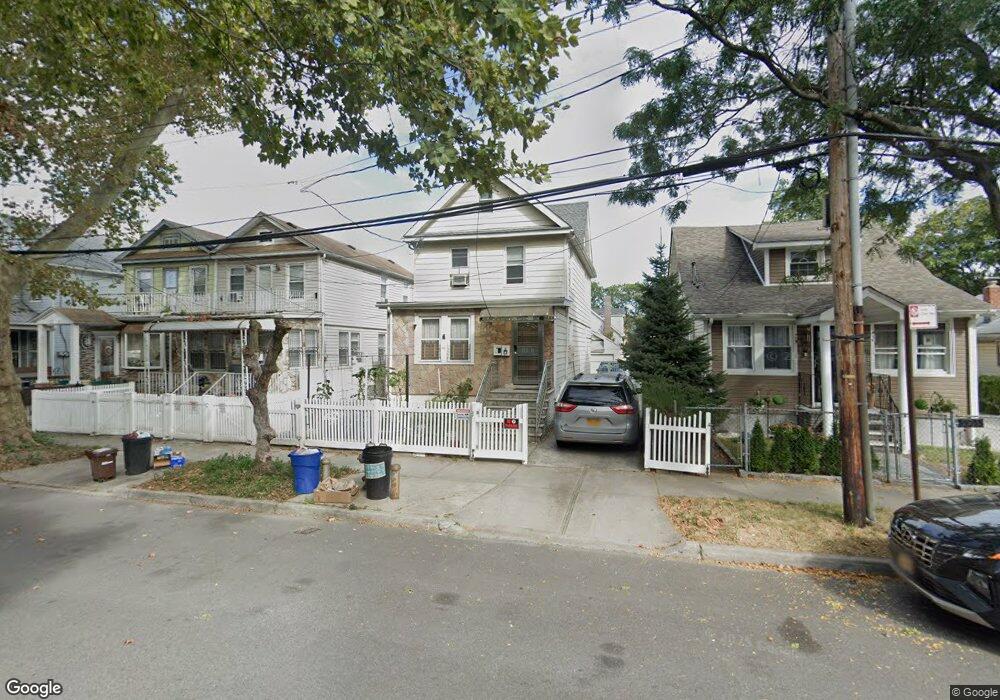
16211 78th Rd Fresh Meadows, NY 11366
Kew Gardens Hills NeighborhoodEstimated Value: $1,106,000 - $1,248,000
--
Bed
--
Bath
1,728
Sq Ft
$672/Sq Ft
Est. Value
About This Home
This home is located at 16211 78th Rd, Fresh Meadows, NY 11366 and is currently estimated at $1,161,946, approximately $672 per square foot. 16211 78th Rd is a home located in Queens County with nearby schools including P.S. 154, I.S. 250 - The Robert F. Kennedy Community Middle School, and Al-Mamoor School.
Ownership History
Date
Name
Owned For
Owner Type
Purchase Details
Closed on
Jun 28, 2010
Sold by
Chen De Ming
Bought by
Li Leslie Yan
Current Estimated Value
Home Financials for this Owner
Home Financials are based on the most recent Mortgage that was taken out on this home.
Original Mortgage
$499,500
Outstanding Balance
$331,426
Interest Rate
4.69%
Estimated Equity
$830,520
Purchase Details
Closed on
Apr 22, 2004
Sold by
Rampersad Wayne
Bought by
Chen De Ming and Zheng Yi Mei
Home Financials for this Owner
Home Financials are based on the most recent Mortgage that was taken out on this home.
Original Mortgage
$360,000
Interest Rate
5.39%
Mortgage Type
Purchase Money Mortgage
Purchase Details
Closed on
Dec 6, 1999
Sold by
Mossop Ivan D and Mossop Sharon D
Bought by
Rampersad Wayne
Home Financials for this Owner
Home Financials are based on the most recent Mortgage that was taken out on this home.
Original Mortgage
$188,446
Interest Rate
7.73%
Mortgage Type
FHA
Create a Home Valuation Report for This Property
The Home Valuation Report is an in-depth analysis detailing your home's value as well as a comparison with similar homes in the area
Home Values in the Area
Average Home Value in this Area
Purchase History
| Date | Buyer | Sale Price | Title Company |
|---|---|---|---|
| Li Leslie Yan | $639,000 | -- | |
| Chen De Ming | $480,000 | -- | |
| Rampersad Wayne | $190,000 | Commonwealth Land Title Ins |
Source: Public Records
Mortgage History
| Date | Status | Borrower | Loan Amount |
|---|---|---|---|
| Open | Li Leslie Yan | $499,500 | |
| Previous Owner | Chen De Ming | $360,000 | |
| Previous Owner | Rampersad Wayne | $188,446 |
Source: Public Records
Tax History Compared to Growth
Tax History
| Year | Tax Paid | Tax Assessment Tax Assessment Total Assessment is a certain percentage of the fair market value that is determined by local assessors to be the total taxable value of land and additions on the property. | Land | Improvement |
|---|---|---|---|---|
| 2025 | $7,540 | $39,793 | $9,809 | $29,984 |
| 2024 | $7,540 | $37,542 | $10,124 | $27,418 |
| 2023 | $7,197 | $35,831 | $9,598 | $26,233 |
| 2022 | $6,667 | $58,740 | $16,860 | $41,880 |
| 2021 | $7,035 | $62,820 | $16,860 | $45,960 |
| 2020 | $6,723 | $62,820 | $16,860 | $45,960 |
| 2019 | $6,252 | $58,020 | $16,860 | $41,160 |
| 2018 | $5,789 | $29,859 | $11,541 | $18,318 |
| 2017 | $5,618 | $29,030 | $12,230 | $16,800 |
| 2016 | $5,494 | $29,030 | $12,230 | $16,800 |
| 2015 | $3,083 | $27,634 | $13,163 | $14,471 |
| 2014 | $3,083 | $26,071 | $12,033 | $14,038 |
Source: Public Records
Map
Nearby Homes
- 77-14 162nd St
- 162-15 77th Ave
- 8012 165th St
- 158-36 77th Rd
- 8102 164th Place
- 16414 81st Ave
- 158-16 79th Ave Unit 411n
- 8108 164th Place
- 164-34 77th Ave
- 76-33 160th St
- 164-38 77th Ave
- 15815 Union Turnpike Unit 2B
- 158-18 77th Ave
- 160-20 76th Ave
- 158-15 Union Turnpike Unit 2A
- 158-15 Union Turnpike Unit 2D
- 158-15 Union Turnpike Unit 205N
- 158-15 Union Turnpike Unit 209N
- 8041 159th St
- 153-51 77th Rd