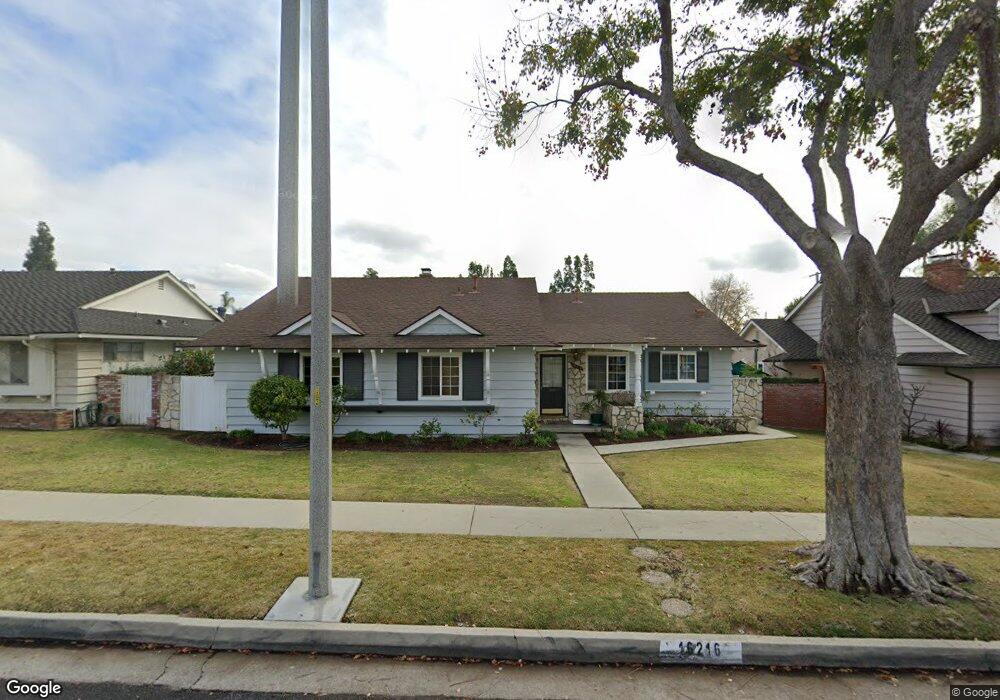
16216 Skagway St Whittier, CA 90603
South Whittier NeighborhoodEstimated Value: $959,000 - $1,026,000
3
Beds
2
Baths
1,669
Sq Ft
$594/Sq Ft
Est. Value
About This Home
This home is located at 16216 Skagway St, Whittier, CA 90603 and is currently estimated at $991,302, approximately $593 per square foot. 16216 Skagway St is a home located in Los Angeles County with nearby schools including Macy Elementary School, Rancho-Starbuck Intermediate School, and La Habra High School.
Ownership History
Date
Name
Owned For
Owner Type
Purchase Details
Closed on
Sep 10, 2003
Sold by
Velarde Mike J and Velarde Cecilia L
Bought by
Velarde Mike J
Current Estimated Value
Home Financials for this Owner
Home Financials are based on the most recent Mortgage that was taken out on this home.
Original Mortgage
$241,900
Interest Rate
6.3%
Mortgage Type
Purchase Money Mortgage
Purchase Details
Closed on
Apr 9, 2003
Sold by
Velarde Mike J and Velarde Cecilia L
Bought by
Velarde Mike J
Purchase Details
Closed on
Oct 26, 2001
Sold by
Wolfslau David G and Wolfslau Wendy J
Bought by
Velarde Mike J
Home Financials for this Owner
Home Financials are based on the most recent Mortgage that was taken out on this home.
Original Mortgage
$239,400
Interest Rate
6.57%
Purchase Details
Closed on
Mar 30, 1994
Sold by
Peters Mary Isabel
Bought by
Wolfslau David G
Home Financials for this Owner
Home Financials are based on the most recent Mortgage that was taken out on this home.
Original Mortgage
$176,000
Interest Rate
8.6%
Create a Home Valuation Report for This Property
The Home Valuation Report is an in-depth analysis detailing your home's value as well as a comparison with similar homes in the area
Home Values in the Area
Average Home Value in this Area
Purchase History
| Date | Buyer | Sale Price | Title Company |
|---|---|---|---|
| Velarde Mike J | -- | -- | |
| Velarde Mike J | -- | Chicago | |
| Velarde Mike J | -- | -- | |
| Velarde Mike J | $302,500 | Southland Title Corporation | |
| Wolfslau David G | $220,000 | Southland Title Corporation |
Source: Public Records
Mortgage History
| Date | Status | Borrower | Loan Amount |
|---|---|---|---|
| Previous Owner | Velarde Mike J | $241,900 | |
| Previous Owner | Velarde Mike J | $239,400 | |
| Previous Owner | Wolfslau David G | $176,000 |
Source: Public Records
Tax History Compared to Growth
Tax History
| Year | Tax Paid | Tax Assessment Tax Assessment Total Assessment is a certain percentage of the fair market value that is determined by local assessors to be the total taxable value of land and additions on the property. | Land | Improvement |
|---|---|---|---|---|
| 2025 | $5,498 | $446,858 | $286,438 | $160,420 |
| 2024 | $5,498 | $438,097 | $280,822 | $157,275 |
| 2023 | $5,475 | $429,508 | $275,316 | $154,192 |
| 2022 | $5,455 | $421,087 | $269,918 | $151,169 |
| 2021 | $5,332 | $412,831 | $264,626 | $148,205 |
| 2019 | $5,061 | $400,588 | $256,778 | $143,810 |
| 2018 | $4,722 | $392,735 | $251,744 | $140,991 |
| 2016 | $4,489 | $377,486 | $241,969 | $135,517 |
| 2015 | $4,329 | $371,817 | $238,335 | $133,482 |
| 2014 | $4,279 | $364,535 | $233,667 | $130,868 |
Source: Public Records
Map
Nearby Homes
- 10418 Bogardus Ave Unit 4
- 10303 Pounds Ave
- 15975 Graceldo Ln
- 16046 Gables Loop
- 16164 Leffco Rd
- 1436 La Riata Dr
- 0 Cloister Dr Unit OC24116252
- 16121 Lisco St
- 16540 Whittier Blvd
- 16635 Monte Oro Dr
- 2401 Canfield Dr
- 1525 Bonnie Jean Ln
- 2311 Canfield Dr
- 15850 Arbela Dr
- 10931 Groveside Ave
- 10930 Groveland Ave
- 2611 Gregory Ln
- 15914 Lashburn St
- 9331 Mikinda Ave
- 15413 Ashley Ct
- 16210 Skagway St
- 16220 Skagway St
- 16228 Skagway St
- 16204 Skagway St
- 16217 Russell St
- 16225 Russell St
- 16211 Russell St
- 16217 Skagway St
- 16211 Skagway St
- 16223 Skagway St
- 16231 Russell St
- 16203 Russell St
- 16236 Skagway St
- 16231 Skagway St
- 16203 Skagway St
- 16237 Russell St
- 16237 Skagway St
- 16242 Skagway St
- 16216 Honnington St
- 16220 Honnington St