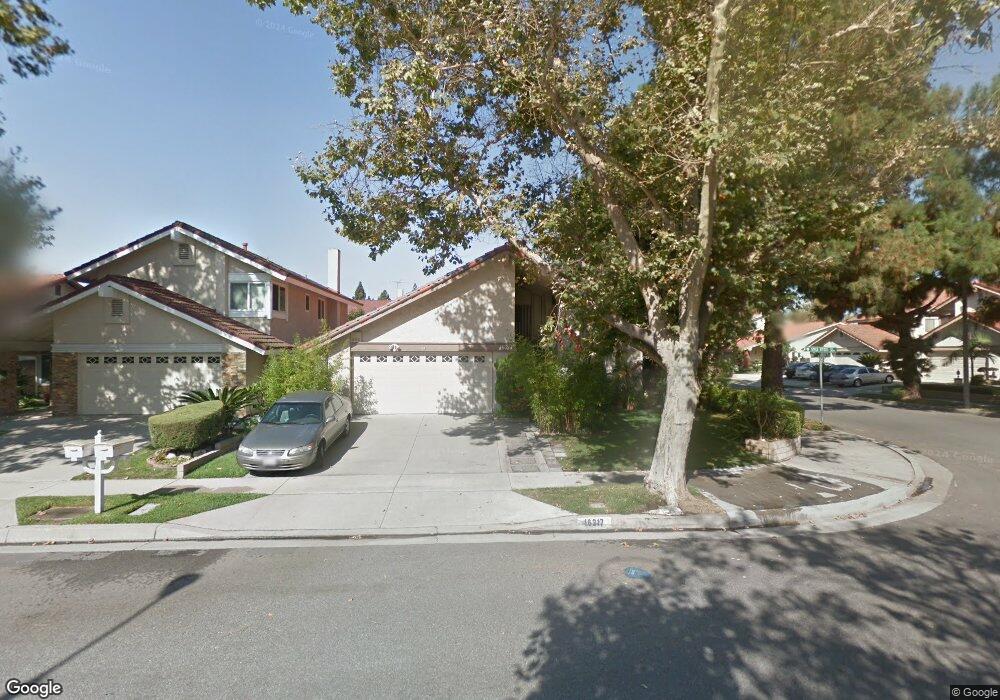
16217 Still Knoll Ln Cerritos, CA 90703
Estimated Value: $879,000 - $1,154,000
3
Beds
2
Baths
1,677
Sq Ft
$588/Sq Ft
Est. Value
About This Home
This home is located at 16217 Still Knoll Ln, Cerritos, CA 90703 and is currently estimated at $985,648, approximately $587 per square foot. 16217 Still Knoll Ln is a home located in Los Angeles County with nearby schools including Juarez Academy of Engineering & Technology, Ross (Faye) Middle School, and Gahr High School.
Ownership History
Date
Name
Owned For
Owner Type
Purchase Details
Closed on
Sep 13, 2018
Sold by
Nguyen Hanh N
Bought by
Nguyen Hanh N and Nguyen Pham Nho T
Current Estimated Value
Purchase Details
Closed on
Dec 3, 2004
Sold by
Pham Hanh N and Nguyen Nho T
Bought by
The Pham Nguyen Family Trust
Purchase Details
Closed on
Jan 22, 2003
Sold by
Pham Hanh N and Nguyen Nho T
Bought by
Pham Hanh N
Purchase Details
Closed on
Apr 21, 1994
Sold by
The Jones Company
Bought by
Radhakrishnan Kodumudi S
Home Financials for this Owner
Home Financials are based on the most recent Mortgage that was taken out on this home.
Original Mortgage
$182,400
Interest Rate
7.79%
Purchase Details
Closed on
Apr 5, 1994
Sold by
Radhakrishnan Kodumudi S and Radhakrishnan Usha
Bought by
Pham Hanh Nguyen
Home Financials for this Owner
Home Financials are based on the most recent Mortgage that was taken out on this home.
Original Mortgage
$182,400
Interest Rate
7.79%
Create a Home Valuation Report for This Property
The Home Valuation Report is an in-depth analysis detailing your home's value as well as a comparison with similar homes in the area
Home Values in the Area
Average Home Value in this Area
Purchase History
| Date | Buyer | Sale Price | Title Company |
|---|---|---|---|
| Nguyen Hanh N | -- | None Available | |
| The Pham Nguyen Family Trust | -- | -- | |
| Pham Hanh N | -- | -- | |
| Pham Hanh N | -- | -- | |
| Radhakrishnan Kodumudi S | -- | Benevest Title | |
| Pham Hanh Nguyen | $228,000 | Benefit Land Title Co |
Source: Public Records
Mortgage History
| Date | Status | Borrower | Loan Amount |
|---|---|---|---|
| Closed | Pham Hanh Nguyen | $182,400 |
Source: Public Records
Tax History Compared to Growth
Tax History
| Year | Tax Paid | Tax Assessment Tax Assessment Total Assessment is a certain percentage of the fair market value that is determined by local assessors to be the total taxable value of land and additions on the property. | Land | Improvement |
|---|---|---|---|---|
| 2025 | $4,733 | $387,492 | $182,021 | $205,471 |
| 2024 | $4,733 | $379,895 | $178,452 | $201,443 |
| 2023 | $4,581 | $372,447 | $174,953 | $197,494 |
| 2022 | $4,509 | $365,145 | $171,523 | $193,622 |
| 2021 | $4,399 | $357,986 | $168,160 | $189,826 |
| 2020 | $4,361 | $354,316 | $166,436 | $187,880 |
| 2019 | $4,296 | $347,370 | $163,173 | $184,197 |
| 2018 | $3,961 | $340,560 | $159,974 | $180,586 |
| 2017 | $25 | $333,884 | $156,838 | $177,046 |
| 2016 | $3,792 | $327,338 | $153,763 | $173,575 |
| 2015 | $3,742 | $322,422 | $151,454 | $170,968 |
| 2014 | $3,671 | $316,107 | $148,488 | $167,619 |
Source: Public Records
Map
Nearby Homes
- 16118 Rockyriver Ln
- 16329 Cherry Fall Ln
- 16011 Sugarpine Ln
- 12121 163rd St
- 12512 Sandycreek Ln
- 15627 Belshire Ave
- 15712 Madris Ave
- 16442 Elaine Ave
- 16308 Indian Creek Rd
- 16429 Westbrook Ln
- 16611 Shenandoah Ave
- 12157 Lowemont St
- 12028 Nava St
- 12167 Cheshire St
- 11871 162nd St
- 12038 Cheshire St
- 16822 Sierra Vista Way
- 12139 Barnwall St
- 11857 Algardi St
- 11945 168th St
- 16223 Still Knoll Ln
- 16216 Stone Grove Ln
- 16303 Still Knoll Ln
- 16222 Stone Grove Ln
- 12263 Glen Creek Rd
- 16300 Stone Grove Ln
- 12257 Glen Creek Rd
- 16309 Still Knoll Ln
- 12253 Glen Creek Rd
- 16218 Still Knoll Ln
- 12267 Glen Creek Rd
- 16224 Still Knoll Ln
- 16302 Still Knoll Ln
- 16306 Stone Grove Ln
- 12247 Glen Creek Rd
- 12303 Glen Creek Rd
- 16313 Still Knoll Ln
- 16308 Still Knoll Ln
- 12241 Glen Creek Rd
- 16121 Rockyriver Ln