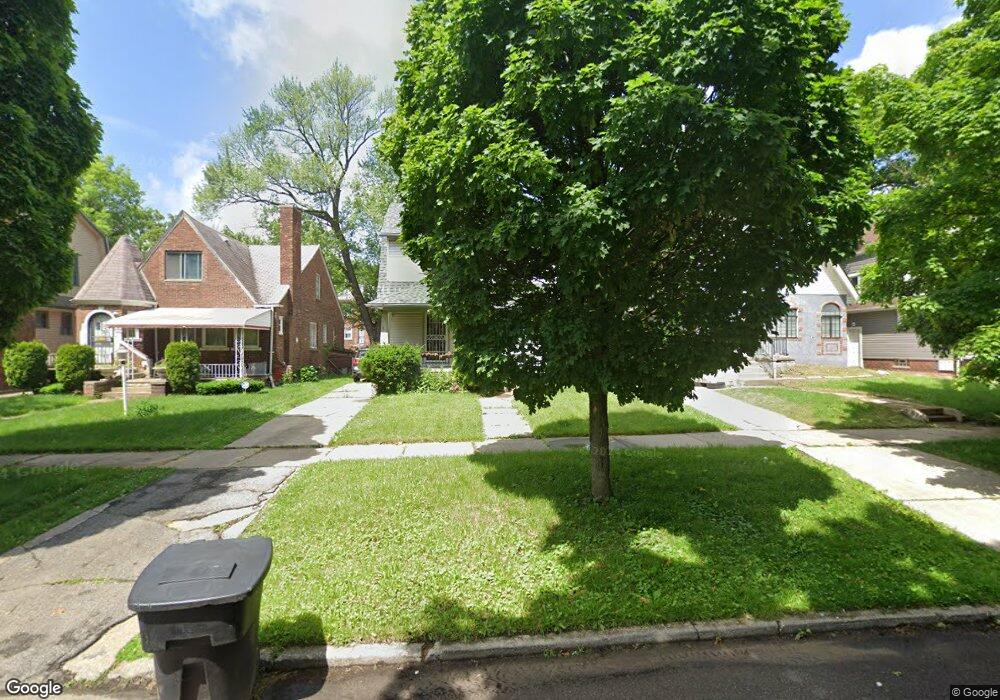
16219 Inverness St Detroit, MI 48221
Martin Park NeighborhoodEstimated Value: $80,643 - $153,000
3
Beds
2
Baths
1,312
Sq Ft
$89/Sq Ft
Est. Value
About This Home
This home is located at 16219 Inverness St, Detroit, MI 48221 and is currently estimated at $116,661, approximately $88 per square foot. 16219 Inverness St is a home located in Wayne County with nearby schools including Paul Robeson Malcolm X Academy, Charles L. Spain Elementary-Middle School, and Edward 'Duke' Ellington Conservatory of Music and Art.
Ownership History
Date
Name
Owned For
Owner Type
Purchase Details
Closed on
Feb 7, 2017
Sold by
Cole Olushakin O
Bought by
Gee Antonio D
Current Estimated Value
Purchase Details
Closed on
Nov 11, 2014
Sold by
Treasurer Of The Charter County Of Wayne
Bought by
Cole Olushakin O
Purchase Details
Closed on
Nov 18, 2011
Sold by
Wojtowicz Raymond J
Bought by
Innter City Systems Llc
Purchase Details
Closed on
Jul 27, 2007
Sold by
Smith Christopher and Smith Jacquelyn E
Bought by
Grennay James
Purchase Details
Closed on
Feb 28, 2006
Sold by
Scully Michael
Bought by
Smith Christopher
Purchase Details
Closed on
Jul 22, 2005
Sold by
Fannie Mae
Bought by
Scully Michael
Purchase Details
Closed on
Jan 26, 2005
Sold by
Mortgage Electronic Registration Systems
Bought by
Federal National Mortgage Association
Purchase Details
Closed on
Jul 7, 2004
Sold by
Rashed Offie T
Bought by
Mortgage Electronic Registration Systems
Create a Home Valuation Report for This Property
The Home Valuation Report is an in-depth analysis detailing your home's value as well as a comparison with similar homes in the area
Home Values in the Area
Average Home Value in this Area
Purchase History
| Date | Buyer | Sale Price | Title Company |
|---|---|---|---|
| Gee Antonio D | -- | None Available | |
| Cole Olushakin O | $8,600 | None Available | |
| Innter City Systems Llc | $2,100 | None Available | |
| Grennay James | $115,000 | Abstract Title Agency | |
| Smith Christopher | -- | None Available | |
| Scully Michael | $19,000 | Great Lakes Title | |
| Federal National Mortgage Association | -- | -- | |
| Mortgage Electronic Registration Systems | $65,673 | -- |
Source: Public Records
Tax History Compared to Growth
Tax History
| Year | Tax Paid | Tax Assessment Tax Assessment Total Assessment is a certain percentage of the fair market value that is determined by local assessors to be the total taxable value of land and additions on the property. | Land | Improvement |
|---|---|---|---|---|
| 2025 | $569 | $29,500 | $0 | $0 |
| 2024 | $569 | $24,200 | $0 | $0 |
| 2023 | $796 | $19,100 | $0 | $0 |
| 2022 | $842 | $15,500 | $0 | $0 |
| 2021 | $822 | $12,000 | $0 | $0 |
| 2020 | $822 | $10,300 | $0 | $0 |
| 2019 | $811 | $7,700 | $0 | $0 |
| 2018 | $725 | $6,300 | $0 | $0 |
| 2017 | $119 | $6,300 | $0 | $0 |
| 2016 | $1,121 | $12,600 | $0 | $0 |
| 2015 | $1,160 | $11,600 | $0 | $0 |
| 2013 | $1,867 | $18,667 | $0 | $0 |
| 2010 | -- | $25,910 | $959 | $24,951 |
Source: Public Records
Map
Nearby Homes
- 16814 Log Cabin St
- 16825 Log Cabin St
- 16309 Log Cabin St
- 16139 Inverness St
- 16520 Baylis St
- 16160 La Salle Ave
- 16514 La Salle Ave
- 1989 Eason St
- 16162 Normandy St
- 1958 Louise St
- 2032 Puritan St
- 1983 Brighton St
- 1917 Louise St
- 15877 Baylis St
- 16801 Log Cabin St
- 16810 Baylis St
- 15856 Baylis St
- 16809 Log Cabin St
- 131 Brighton St
- 16815 Log Cabin St
- 16211 Inverness St
- 16225 Inverness St
- 16235 Inverness St
- 16203 Inverness St
- 16241 Inverness St
- 16216 Baylis St
- 16195 Inverness St
- 16208 Baylis St
- 16224 Baylis St
- 16189 Iverness
- 16200 Baylis St
- 16232 Baylis St
- 16226 Inverness St
- 16249 Inverness St
- 16194 Baylis St
- 16240 Baylis St
- 16216 Inverness St
- 16177 Inverness St
- 16210 Inverness St
- 16255 Inverness St