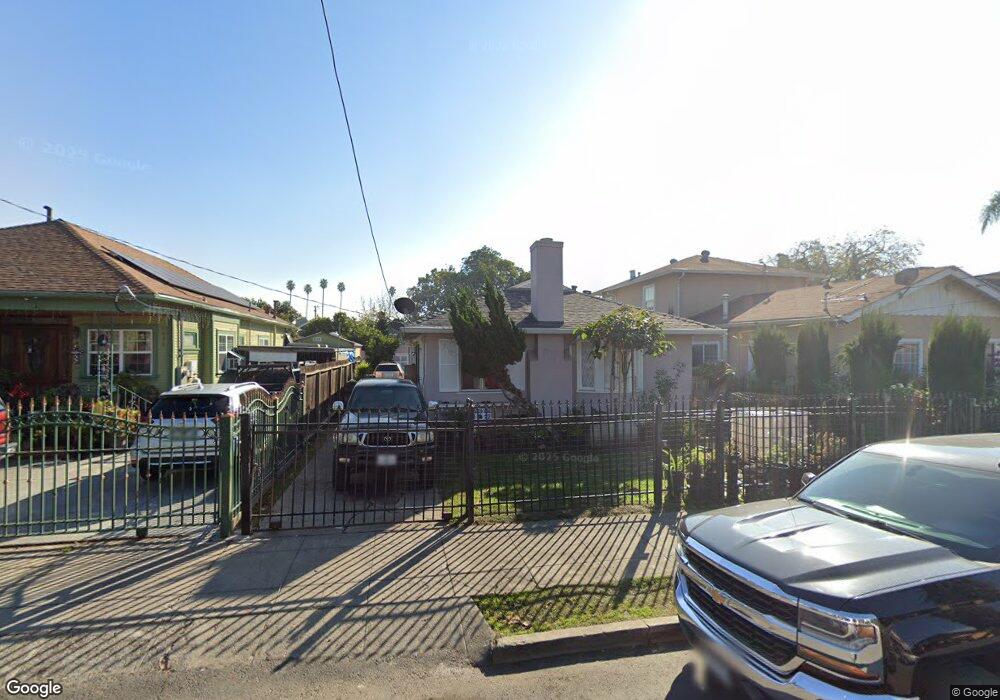
1622 89th Ave Oakland, CA 94621
Webster NeighborhoodEstimated Value: $447,000 - $571,000
3
Beds
2
Baths
1,308
Sq Ft
$376/Sq Ft
Est. Value
About This Home
This home is located at 1622 89th Ave, Oakland, CA 94621 and is currently estimated at $491,932, approximately $376 per square foot. 1622 89th Ave is a home located in Alameda County with nearby schools including East Oakland Pride Elementary School, Elmhurst United Middle School, and Coliseum College Prep Academy.
Ownership History
Date
Name
Owned For
Owner Type
Purchase Details
Closed on
Mar 1, 2010
Sold by
Day Michelle
Bought by
Dawson Norris E
Current Estimated Value
Purchase Details
Closed on
Apr 10, 2008
Sold by
Dawson Adia
Bought by
Day Michelle
Purchase Details
Closed on
Jan 29, 2008
Sold by
Payne Doris Ford and Leo Courtney Jr Declaration Of
Bought by
Dawson Adia
Purchase Details
Closed on
Dec 18, 2003
Sold by
Courtney Leo
Bought by
Courtney Leo and The Leo Courtney Jr Declaratio
Purchase Details
Closed on
Oct 18, 1996
Sold by
Dawson Norris E and Dawson Barbara
Bought by
Courtney Leo
Create a Home Valuation Report for This Property
The Home Valuation Report is an in-depth analysis detailing your home's value as well as a comparison with similar homes in the area
Home Values in the Area
Average Home Value in this Area
Purchase History
| Date | Buyer | Sale Price | Title Company |
|---|---|---|---|
| Dawson Norris E | -- | None Available | |
| Day Michelle | -- | None Available | |
| Dawson Adia | -- | None Available | |
| Courtney Leo | -- | -- | |
| Courtney Leo | -- | -- |
Source: Public Records
Tax History Compared to Growth
Tax History
| Year | Tax Paid | Tax Assessment Tax Assessment Total Assessment is a certain percentage of the fair market value that is determined by local assessors to be the total taxable value of land and additions on the property. | Land | Improvement |
|---|---|---|---|---|
| 2025 | $4,457 | $160,137 | $48,041 | $112,096 |
| 2024 | $4,457 | $156,998 | $47,099 | $109,899 |
| 2023 | $4,521 | $153,920 | $46,176 | $107,744 |
| 2022 | $4,268 | $150,903 | $45,271 | $105,632 |
| 2021 | $4,003 | $147,944 | $44,383 | $103,561 |
| 2020 | $3,712 | $146,428 | $43,928 | $102,500 |
| 2019 | $3,440 | $143,558 | $43,067 | $100,491 |
| 2018 | $3,372 | $140,744 | $42,223 | $98,521 |
| 2017 | $4,143 | $137,985 | $41,395 | $96,590 |
| 2016 | $3,578 | $135,280 | $40,584 | $94,696 |
| 2015 | $3,985 | $133,250 | $39,975 | $93,275 |
| 2014 | $4,032 | $130,640 | $39,192 | $91,448 |
Source: Public Records
Map
Nearby Homes