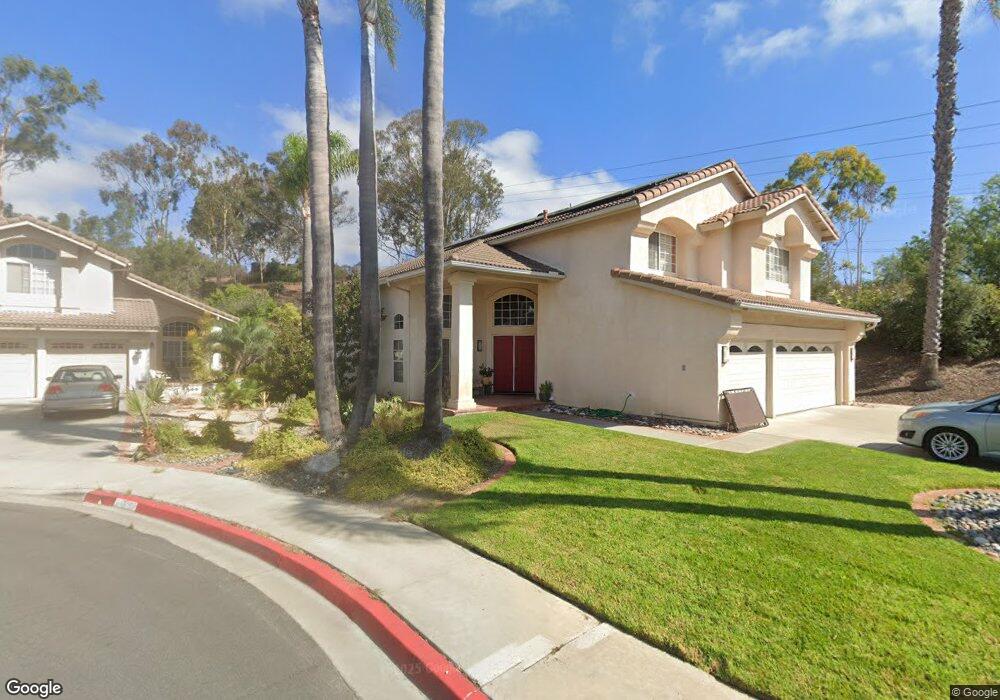
1622 Dawson Dr Vista, CA 92081
Shadowridge NeighborhoodEstimated Value: $1,149,000 - $1,239,000
4
Beds
3
Baths
2,667
Sq Ft
$449/Sq Ft
Est. Value
About This Home
This home is located at 1622 Dawson Dr, Vista, CA 92081 and is currently estimated at $1,197,210, approximately $448 per square foot. 1622 Dawson Dr is a home located in San Diego County with nearby schools including Lake Elementary School, Madison Middle School, and Rancho Buena Vista High School.
Ownership History
Date
Name
Owned For
Owner Type
Purchase Details
Closed on
May 4, 2020
Sold by
Klovanish Elizabeth M
Bought by
Klovanish Elizabeth M
Current Estimated Value
Purchase Details
Closed on
Sep 26, 2012
Sold by
Klovanish Steven T
Bought by
Klovanish Elizabeth M
Purchase Details
Closed on
Mar 2, 2000
Sold by
Cadieux Todd A and Cadieux Jody L
Bought by
Klovanish Steven T and Klovanish Elizabeth M
Home Financials for this Owner
Home Financials are based on the most recent Mortgage that was taken out on this home.
Original Mortgage
$218,000
Interest Rate
8.24%
Mortgage Type
Balloon
Purchase Details
Closed on
Mar 13, 1995
Sold by
Meeker Development Company Inc
Bought by
Cadieux Todd A and Cadieux Jody L
Home Financials for this Owner
Home Financials are based on the most recent Mortgage that was taken out on this home.
Original Mortgage
$192,900
Interest Rate
7.5%
Create a Home Valuation Report for This Property
The Home Valuation Report is an in-depth analysis detailing your home's value as well as a comparison with similar homes in the area
Home Values in the Area
Average Home Value in this Area
Purchase History
| Date | Buyer | Sale Price | Title Company |
|---|---|---|---|
| Klovanish Elizabeth M | -- | None Available | |
| Klovanish Elizabeth M | -- | None Available | |
| Klovanish Steven T | $318,000 | First American Title | |
| Cadieux Todd A | $214,500 | Chicago Title Company |
Source: Public Records
Mortgage History
| Date | Status | Borrower | Loan Amount |
|---|---|---|---|
| Previous Owner | Klovanish Steven T | $218,000 | |
| Previous Owner | Cadieux Todd A | $192,900 |
Source: Public Records
Tax History Compared to Growth
Tax History
| Year | Tax Paid | Tax Assessment Tax Assessment Total Assessment is a certain percentage of the fair market value that is determined by local assessors to be the total taxable value of land and additions on the property. | Land | Improvement |
|---|---|---|---|---|
| 2025 | $6,007 | $488,734 | $114,021 | $374,713 |
| 2024 | $6,007 | $479,152 | $111,786 | $367,366 |
| 2023 | $5,881 | $469,758 | $109,595 | $360,163 |
| 2022 | $5,867 | $460,548 | $107,447 | $353,101 |
| 2021 | $5,739 | $451,519 | $105,341 | $346,178 |
| 2020 | $5,708 | $446,890 | $104,261 | $342,629 |
| 2019 | $5,628 | $438,128 | $102,217 | $335,911 |
| 2018 | $5,388 | $429,538 | $100,213 | $329,325 |
| 2017 | $121 | $421,117 | $98,249 | $322,868 |
| 2016 | $5,180 | $412,861 | $96,323 | $316,538 |
| 2015 | $5,152 | $406,661 | $94,877 | $311,784 |
| 2014 | $5,031 | $398,696 | $93,019 | $305,677 |
Source: Public Records
Map
Nearby Homes
- 1632 Mountain Pass Cir
- 1685 Mountain Pass Cir
- 2225 Baxter Canyon Rd
- 2244 Eastbrook Rd
- 2056 White Birch Dr
- 2027 Harmony Way
- 1533 Harbor Dr
- 1916 Rosewood St
- 1930 Rosewood St
- 0 Green Oak Rd
- 1829 Shadowood Cir
- 2042 Redwood Crest
- 2436 Links Way
- 1205 Columbus Way
- 954 Sheffield Dr
- 4994 Alicante Way
- 1060 Kendale Way
- 4914 Tilos Way Unit 5B
- 5174 Berryessa St
- 911 Concord Ct