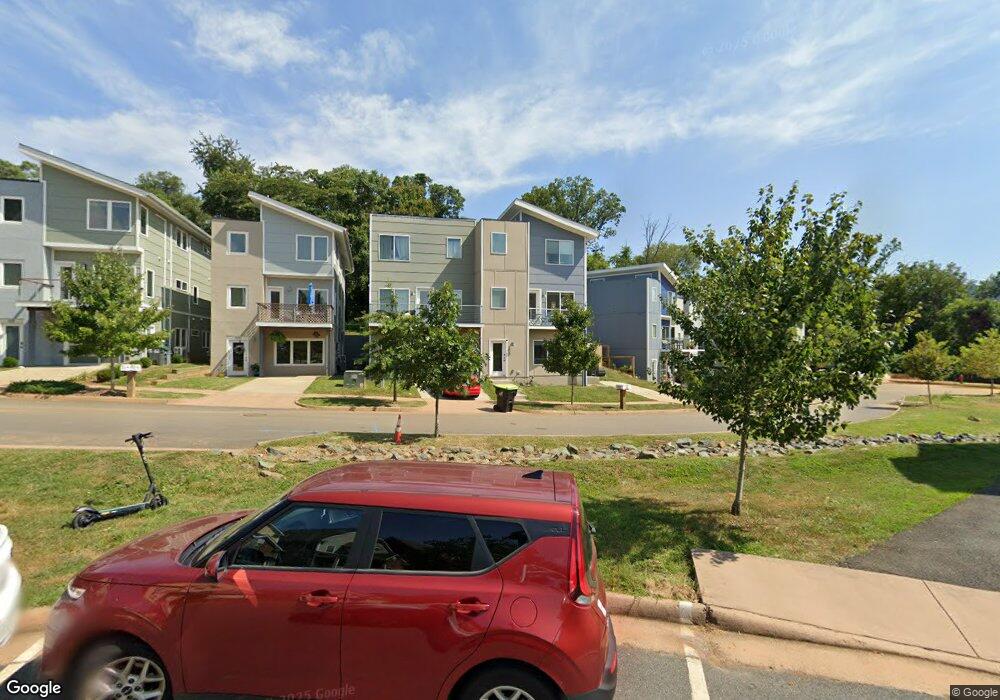
1622 Rialto St Charlottesville, VA 22902
Belmont NeighborhoodEstimated Value: $648,000 - $717,000
4
Beds
4
Baths
2,634
Sq Ft
$254/Sq Ft
Est. Value
About This Home
This home is located at 1622 Rialto St, Charlottesville, VA 22902 and is currently estimated at $670,257, approximately $254 per square foot. 1622 Rialto St is a home located in Charlottesville City with nearby schools including Jackson-Via Elementary School, Buford Middle School, and Charlottesville High School.
Ownership History
Date
Name
Owned For
Owner Type
Purchase Details
Closed on
Jan 26, 2022
Sold by
Rialto Townhomes Llc
Bought by
Lowe Elizabeth A and Vanderhart Robert E
Current Estimated Value
Home Financials for this Owner
Home Financials are based on the most recent Mortgage that was taken out on this home.
Original Mortgage
$508,806
Outstanding Balance
$472,522
Interest Rate
3.56%
Estimated Equity
$197,735
Purchase Details
Closed on
Mar 18, 2021
Sold by
Rialto Bk Llc
Bought by
Rialto Twnhms Llc
Create a Home Valuation Report for This Property
The Home Valuation Report is an in-depth analysis detailing your home's value as well as a comparison with similar homes in the area
Home Values in the Area
Average Home Value in this Area
Purchase History
| Date | Buyer | Sale Price | Title Company |
|---|---|---|---|
| Lowe Elizabeth A | $535,585 | -- | |
| Rialto Twnhms Llc | -- | -- |
Source: Public Records
Mortgage History
| Date | Status | Borrower | Loan Amount |
|---|---|---|---|
| Open | Lowe Elizabeth A | $508,806 |
Source: Public Records
Tax History Compared to Growth
Tax History
| Year | Tax Paid | Tax Assessment Tax Assessment Total Assessment is a certain percentage of the fair market value that is determined by local assessors to be the total taxable value of land and additions on the property. | Land | Improvement |
|---|---|---|---|---|
| 2025 | $6,306 | $639,100 | $160,000 | $479,100 |
| 2024 | $6,306 | $581,000 | $147,500 | $433,500 |
| 2023 | $5,277 | $545,200 | $137,500 | $407,700 |
| 2022 | $1,309 | $131,900 | $131,900 | $0 |
| 2021 | $1,193 | $125,600 | $125,600 | $0 |
| 2020 | $1,193 | $125,600 | $125,600 | $0 |
| 2019 | $1,115 | $117,400 | $117,400 | $0 |
| 2018 | $516 | $108,700 | $108,700 | $0 |
| 2017 | $288 | $30,300 | $30,300 | $0 |
| 2016 | $261 | $27,500 | $27,500 | $0 |
Source: Public Records
Map
Nearby Homes