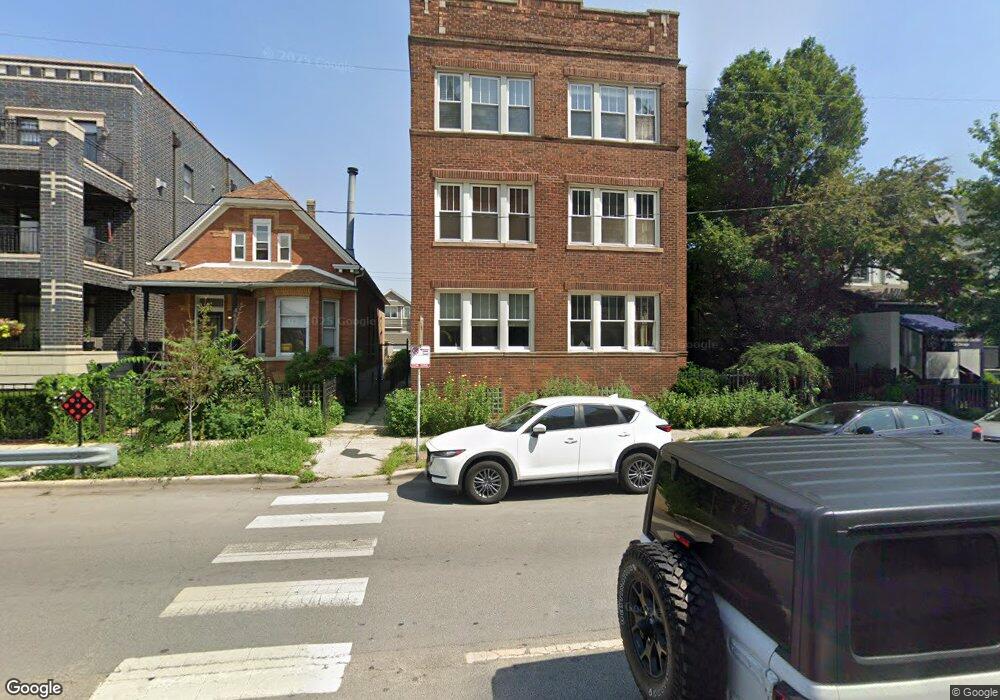
1622 W Diversey Pkwy Unit 1A Chicago, IL 60614
Southport Corridor NeighborhoodEstimated Value: $438,000 - $663,000
3
Beds
2
Baths
2,000
Sq Ft
$282/Sq Ft
Est. Value
About This Home
This home is located at 1622 W Diversey Pkwy Unit 1A, Chicago, IL 60614 and is currently estimated at $564,227, approximately $282 per square foot. 1622 W Diversey Pkwy Unit 1A is a home located in Cook County with nearby schools including Prescott Elementary School, Lincoln Park High School, and Alphonsus Academy & Center For The Arts.
Ownership History
Date
Name
Owned For
Owner Type
Purchase Details
Closed on
Mar 28, 2017
Sold by
Sanchez Eugene L and Rice Sanchez Jennifer
Bought by
Mcginley Patrick and Mcginley Melinda
Current Estimated Value
Home Financials for this Owner
Home Financials are based on the most recent Mortgage that was taken out on this home.
Original Mortgage
$315,000
Outstanding Balance
$261,768
Interest Rate
4.16%
Mortgage Type
New Conventional
Estimated Equity
$302,459
Purchase Details
Closed on
Dec 12, 2007
Sold by
Nowlan Virginia
Bought by
Sanchez Eugene L and Rice Sanchez Jennifer
Home Financials for this Owner
Home Financials are based on the most recent Mortgage that was taken out on this home.
Original Mortgage
$312,500
Interest Rate
6.27%
Mortgage Type
Purchase Money Mortgage
Create a Home Valuation Report for This Property
The Home Valuation Report is an in-depth analysis detailing your home's value as well as a comparison with similar homes in the area
Home Values in the Area
Average Home Value in this Area
Purchase History
| Date | Buyer | Sale Price | Title Company |
|---|---|---|---|
| Mcginley Patrick | $360,000 | Barrister Title | |
| Sanchez Eugene L | $312,500 | Chicago Title Insurance Co |
Source: Public Records
Mortgage History
| Date | Status | Borrower | Loan Amount |
|---|---|---|---|
| Open | Mcginley Patrick | $315,000 | |
| Previous Owner | Sanchez Eugene L | $312,500 |
Source: Public Records
Tax History Compared to Growth
Tax History
| Year | Tax Paid | Tax Assessment Tax Assessment Total Assessment is a certain percentage of the fair market value that is determined by local assessors to be the total taxable value of land and additions on the property. | Land | Improvement |
|---|---|---|---|---|
| 2024 | $5,661 | $31,036 | $12,205 | $18,831 |
| 2023 | $5,497 | $30,148 | $9,843 | $20,305 |
| 2022 | $5,497 | $30,148 | $9,843 | $20,305 |
| 2021 | $5,392 | $30,146 | $9,842 | $20,304 |
| 2020 | $3,381 | $18,280 | $4,409 | $13,871 |
| 2019 | $3,314 | $19,922 | $4,409 | $15,513 |
| 2018 | $3,935 | $19,922 | $4,409 | $15,513 |
| 2017 | $3,413 | $19,229 | $3,937 | $15,292 |
| 2016 | $3,351 | $19,229 | $3,937 | $15,292 |
| 2015 | $3,043 | $19,229 | $3,937 | $15,292 |
| 2014 | $3,858 | $23,363 | $3,208 | $20,155 |
| 2013 | $3,771 | $23,363 | $3,208 | $20,155 |
Source: Public Records
Map
Nearby Homes
- 1636 W Wolfram St
- 1634 W Wolfram St
- 2851 N Ashland Ave Unit 1S
- 1522 W Wolfram St
- 1712 W Diversey Pkwy Unit 1
- 1710 W Surf St Unit 41
- 2754 N Paulina St Unit 2754
- 1712 W Surf St Unit 40
- 1735 W Diversey Pkwy Unit 208
- 1735 W Diversey Pkwy Unit 402
- 1720 W Surf St Unit 36
- 1531 W Oakdale Ave Unit 1
- 2662 N Ashland Ave
- 2642 N Ashland Ave
- 2701 N Hermitage Ave
- 1437 W Diversey Pkwy Unit 1E
- 3003 N Ashland Ave
- 1800 W Diversey Pkwy Unit D
- 2720 N Greenview Ave Unit L
- 1808 W Diversey Pkwy Unit E
- 1622 W Diversey Pkwy Unit 1B
- 1622 W Diversey Pkwy Unit 3B
- 1622 W Diversey Pkwy Unit 2B
- 1622 W Diversey Pkwy Unit 2A
- 1622 W Diversey Pkwy Unit 3A
- 1660 W Diversey Pkwy Unit 2A
- 1660 W Diversey Pkwy Unit 3C
- 1660 W Diversey Pkwy Unit 3A
- 1620 W Diversey Pkwy Unit 1C
- 1620 W Diversey Pkwy Unit 2C
- 1620 W Diversey Pkwy Unit 3C
- 1628 W Diversey Pkwy
- 1614 W Diversey Pkwy
- 1614 W Diversey Pkwy Unit 2
- 1614 W Diversey Pkwy Unit CH
- 1614 W Diversey Pkwy Unit 1
- 1632 W Diversey Pkwy
- 1632 W Diversey Pkwy
- 1632 W Diversey Pkwy Unit 2W
- 1632 W Diversey Pkwy Unit 1W