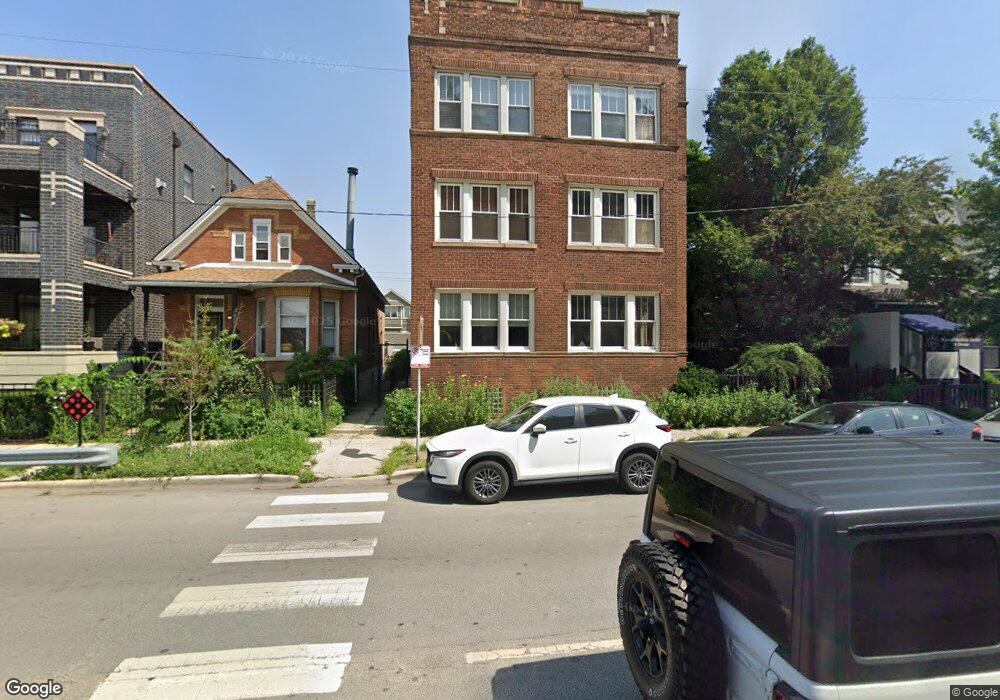
1622 W Diversey Pkwy Unit 1B Chicago, IL 60614
Southport Corridor NeighborhoodEstimated Value: $326,146 - $614,000
2
Beds
1
Bath
925
Sq Ft
$454/Sq Ft
Est. Value
About This Home
This home is located at 1622 W Diversey Pkwy Unit 1B, Chicago, IL 60614 and is currently estimated at $419,537, approximately $453 per square foot. 1622 W Diversey Pkwy Unit 1B is a home located in Cook County with nearby schools including Prescott Elementary School, Lincoln Park High School, and Alphonsus Academy & Center For The Arts.
Ownership History
Date
Name
Owned For
Owner Type
Purchase Details
Closed on
Dec 18, 2017
Sold by
Schindehette Russell S and Schindehette Theresa A
Bought by
Schindehette Russell S and Schindehette Theresa A
Current Estimated Value
Purchase Details
Closed on
Oct 30, 2000
Sold by
Wishman Theresa A and Schindehette Theresa A
Bought by
Schindehette Russell S and Schindehette Theresa A
Home Financials for this Owner
Home Financials are based on the most recent Mortgage that was taken out on this home.
Original Mortgage
$140,000
Outstanding Balance
$51,882
Interest Rate
7.96%
Mortgage Type
Purchase Money Mortgage
Estimated Equity
$367,655
Purchase Details
Closed on
May 31, 1994
Sold by
Martinucci Sergio
Bought by
Kasey Gloria J
Home Financials for this Owner
Home Financials are based on the most recent Mortgage that was taken out on this home.
Original Mortgage
$80,000
Interest Rate
8.45%
Mortgage Type
Purchase Money Mortgage
Create a Home Valuation Report for This Property
The Home Valuation Report is an in-depth analysis detailing your home's value as well as a comparison with similar homes in the area
Home Values in the Area
Average Home Value in this Area
Purchase History
| Date | Buyer | Sale Price | Title Company |
|---|---|---|---|
| Schindehette Russell S | -- | None Available | |
| Schindehette Russell S | -- | Chicago Title Insurance Co | |
| Kasey Gloria J | $84,000 | Intercounty Title |
Source: Public Records
Mortgage History
| Date | Status | Borrower | Loan Amount |
|---|---|---|---|
| Open | Schindehette Russell S | $140,000 | |
| Closed | Kasey Gloria J | $80,000 |
Source: Public Records
Tax History Compared to Growth
Tax History
| Year | Tax Paid | Tax Assessment Tax Assessment Total Assessment is a certain percentage of the fair market value that is determined by local assessors to be the total taxable value of land and additions on the property. | Land | Improvement |
|---|---|---|---|---|
| 2024 | $4,730 | $23,216 | $9,130 | $14,086 |
| 2023 | $4,611 | $22,418 | $7,363 | $15,055 |
| 2022 | $4,611 | $22,418 | $7,363 | $15,055 |
| 2021 | $4,508 | $22,416 | $7,362 | $15,054 |
| 2020 | $3,046 | $13,673 | $3,298 | $10,375 |
| 2019 | $2,994 | $14,902 | $3,298 | $11,604 |
| 2018 | $2,944 | $14,902 | $3,298 | $11,604 |
| 2017 | $3,096 | $14,384 | $2,945 | $11,439 |
| 2016 | $2,881 | $14,384 | $2,945 | $11,439 |
| 2015 | $2,636 | $14,384 | $2,945 | $11,439 |
| 2014 | $3,242 | $17,476 | $2,400 | $15,076 |
| 2013 | $3,178 | $17,476 | $2,400 | $15,076 |
Source: Public Records
Map
Nearby Homes
- 1634 W Wolfram St
- 2851 N Ashland Ave Unit 1S
- 1522 W Wolfram St
- 1710 W Surf St Unit 41
- 1531 W Oakdale Ave Unit 1
- 1712 W Diversey Pkwy Unit 1
- 1712 W Surf St Unit 40
- 2754 N Paulina St Unit 2754
- 1720 W Surf St Unit 36
- 2662 N Ashland Ave
- 1735 W Diversey Pkwy Unit 208
- 1735 W Diversey Pkwy Unit 402
- 1437 W Diversey Pkwy Unit 1E
- 3003 N Ashland Ave
- 2642 N Ashland Ave
- 2720 N Greenview Ave Unit L
- 2701 N Hermitage Ave
- 1800 W Diversey Pkwy Unit D
- 2616 N Marshfield Ave
- 1808 W Diversey Pkwy Unit E
- 1622 W Diversey Pkwy Unit 3B
- 1622 W Diversey Pkwy Unit 2B
- 1622 W Diversey Pkwy Unit 1A
- 1622 W Diversey Pkwy Unit 2A
- 1622 W Diversey Pkwy Unit 3A
- 1660 W Diversey Pkwy Unit 2A
- 1660 W Diversey Pkwy Unit 3C
- 1660 W Diversey Pkwy Unit 3A
- 1620 W Diversey Pkwy Unit 1C
- 1620 W Diversey Pkwy Unit 2C
- 1620 W Diversey Pkwy Unit 3C
- 1628 W Diversey Pkwy
- 1614 W Diversey Pkwy
- 1614 W Diversey Pkwy Unit 2
- 1614 W Diversey Pkwy Unit CH
- 1614 W Diversey Pkwy Unit 1
- 1632 W Diversey Pkwy
- 1632 W Diversey Pkwy
- 1632 W Diversey Pkwy Unit 2W
- 1632 W Diversey Pkwy Unit 1W