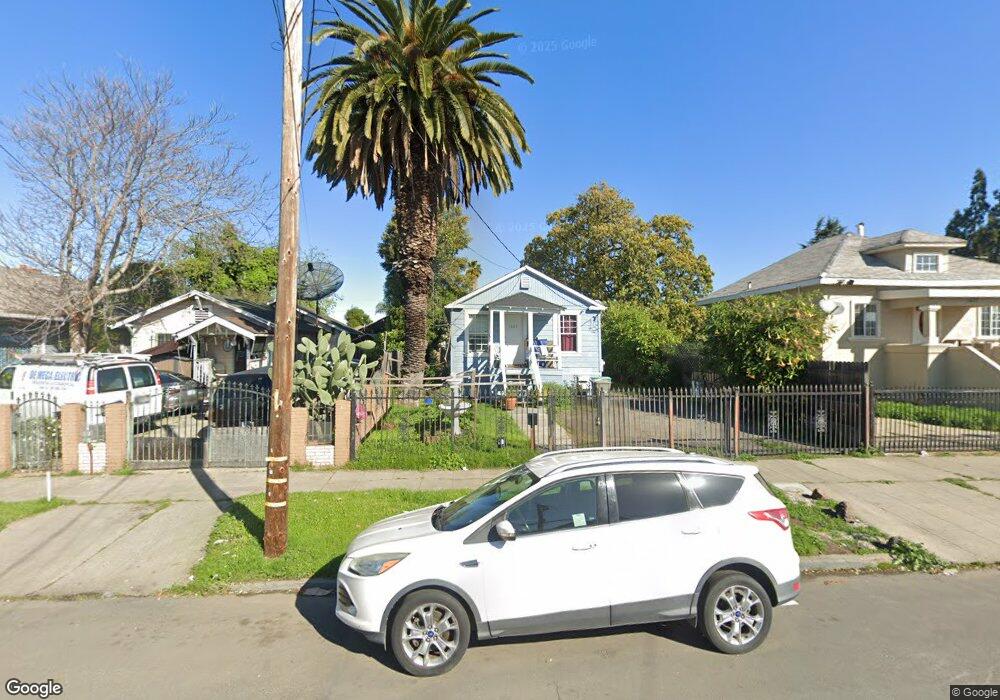
1623 90th Ave Oakland, CA 94603
Webster NeighborhoodEstimated Value: $415,000 - $488,000
2
Beds
1
Bath
584
Sq Ft
$755/Sq Ft
Est. Value
About This Home
This home is located at 1623 90th Ave, Oakland, CA 94603 and is currently estimated at $441,105, approximately $755 per square foot. 1623 90th Ave is a home located in Alameda County with nearby schools including East Oakland Pride Elementary School, Elmhurst United Middle School, and Coliseum College Prep Academy.
Ownership History
Date
Name
Owned For
Owner Type
Purchase Details
Closed on
Feb 6, 2024
Sold by
Gomez Jose Baldomero
Bought by
Rocha Gustavo Adolfo
Current Estimated Value
Home Financials for this Owner
Home Financials are based on the most recent Mortgage that was taken out on this home.
Original Mortgage
$426,550
Outstanding Balance
$419,012
Interest Rate
6.61%
Mortgage Type
New Conventional
Estimated Equity
$22,093
Purchase Details
Closed on
Nov 22, 2023
Sold by
Gomez Jose Baldomero
Bought by
Jose B Gomez And Maria V Gomez Revocable Livi and Gomez
Create a Home Valuation Report for This Property
The Home Valuation Report is an in-depth analysis detailing your home's value as well as a comparison with similar homes in the area
Home Values in the Area
Average Home Value in this Area
Purchase History
| Date | Buyer | Sale Price | Title Company |
|---|---|---|---|
| Rocha Gustavo Adolfo | $449,000 | Fidelity National Title Compan | |
| Jose B Gomez And Maria V Gomez Revocable Livi | -- | None Listed On Document |
Source: Public Records
Mortgage History
| Date | Status | Borrower | Loan Amount |
|---|---|---|---|
| Open | Rocha Gustavo Adolfo | $426,550 |
Source: Public Records
Tax History Compared to Growth
Tax History
| Year | Tax Paid | Tax Assessment Tax Assessment Total Assessment is a certain percentage of the fair market value that is determined by local assessors to be the total taxable value of land and additions on the property. | Land | Improvement |
|---|---|---|---|---|
| 2025 | $3,509 | $457,980 | $137,394 | $320,586 |
| 2024 | $3,509 | $131,734 | $39,520 | $92,214 |
| 2023 | $3,693 | $129,151 | $38,745 | $90,406 |
| 2022 | $3,411 | $126,620 | $37,986 | $88,634 |
| 2021 | $3,122 | $124,137 | $37,241 | $86,896 |
| 2020 | $3,086 | $122,864 | $36,859 | $86,005 |
| 2019 | $3,266 | $120,455 | $36,136 | $84,319 |
| 2018 | $3,293 | $118,094 | $35,428 | $82,666 |
| 2017 | $2,815 | $115,778 | $34,733 | $81,045 |
| 2016 | $2,513 | $113,508 | $34,052 | $79,456 |
| 2015 | $2,644 | $111,804 | $33,541 | $78,263 |
| 2014 | $2,588 | $109,614 | $32,884 | $76,730 |
Source: Public Records
Map
Nearby Homes