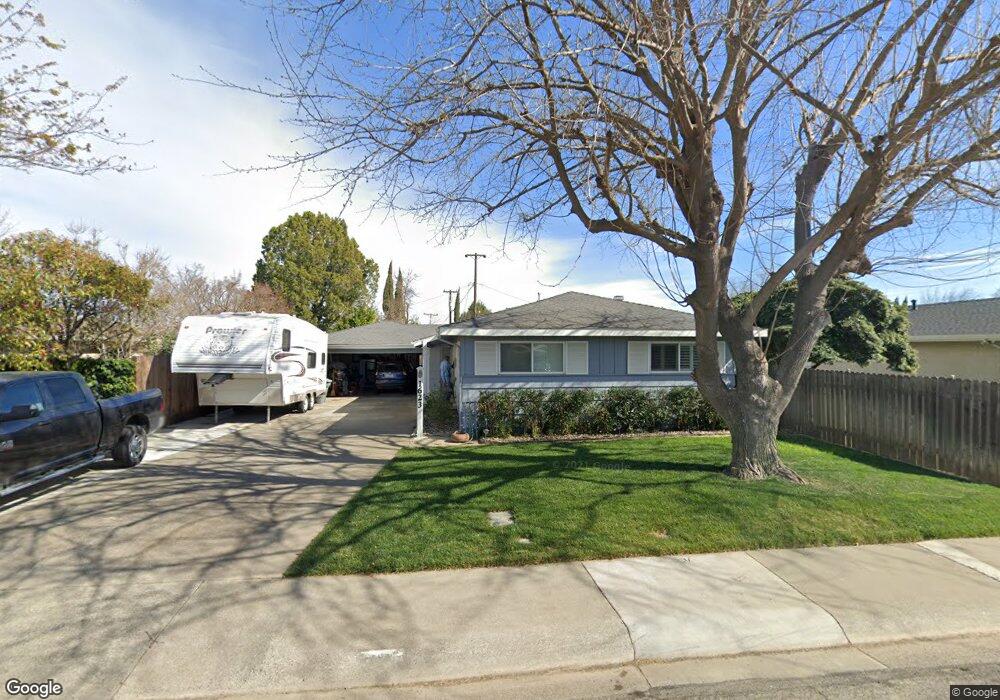
1623 Camino Way Woodland, CA 95695
Estimated Value: $385,000 - $478,000
3
Beds
2
Baths
1,200
Sq Ft
$373/Sq Ft
Est. Value
About This Home
This home is located at 1623 Camino Way, Woodland, CA 95695 and is currently estimated at $447,801, approximately $373 per square foot. 1623 Camino Way is a home located in Yolo County with nearby schools including Gibson Elementary School, Douglass Middle School, and Pioneer High School.
Ownership History
Date
Name
Owned For
Owner Type
Purchase Details
Closed on
Aug 19, 2020
Sold by
Hall Penny J
Bought by
Hall Penny J and The Penny Hall Family Trust
Current Estimated Value
Purchase Details
Closed on
Nov 28, 2011
Sold by
Hall Penny J and Smith Penny J
Bought by
Hall Penny J
Home Financials for this Owner
Home Financials are based on the most recent Mortgage that was taken out on this home.
Original Mortgage
$130,500
Outstanding Balance
$89,485
Interest Rate
4.06%
Mortgage Type
New Conventional
Estimated Equity
$358,316
Purchase Details
Closed on
Sep 24, 1999
Sold by
Harris Gaines and Harris Melvin
Bought by
Smith Penny J
Home Financials for this Owner
Home Financials are based on the most recent Mortgage that was taken out on this home.
Original Mortgage
$112,000
Interest Rate
7.97%
Create a Home Valuation Report for This Property
The Home Valuation Report is an in-depth analysis detailing your home's value as well as a comparison with similar homes in the area
Home Values in the Area
Average Home Value in this Area
Purchase History
| Date | Buyer | Sale Price | Title Company |
|---|---|---|---|
| Hall Penny J | -- | None Available | |
| Hall Penny J | -- | Placer Title Company | |
| Hall Penny J | -- | Placer Title Company | |
| Smith Penny J | $140,000 | North American Title Guarant |
Source: Public Records
Mortgage History
| Date | Status | Borrower | Loan Amount |
|---|---|---|---|
| Open | Hall Penny J | $130,500 | |
| Closed | Hall Penny J | $130,500 | |
| Closed | Smith Penny J | $112,000 |
Source: Public Records
Tax History Compared to Growth
Tax History
| Year | Tax Paid | Tax Assessment Tax Assessment Total Assessment is a certain percentage of the fair market value that is determined by local assessors to be the total taxable value of land and additions on the property. | Land | Improvement |
|---|---|---|---|---|
| 2025 | $2,144 | $215,152 | $76,838 | $138,314 |
| 2023 | $2,144 | $206,799 | $73,855 | $132,944 |
| 2022 | $2,058 | $202,745 | $72,407 | $130,338 |
| 2021 | $2,023 | $198,771 | $70,988 | $127,783 |
| 2020 | $1,994 | $196,734 | $70,261 | $126,473 |
| 2019 | $1,955 | $192,878 | $68,884 | $123,994 |
| 2018 | $1,934 | $189,097 | $67,534 | $121,563 |
| 2017 | $1,890 | $185,390 | $66,210 | $119,180 |
| 2016 | $1,857 | $181,756 | $64,912 | $116,844 |
| 2015 | $1,792 | $179,026 | $63,937 | $115,089 |
| 2014 | $1,792 | $175,520 | $62,685 | $112,835 |
Source: Public Records
Map
Nearby Homes
- 1634 Coloma Way
- 1627 Carnelian Ct
- 1625 Carnelian Ct
- 1630 Coloma Way
- 1626 Camino Way
- 1626 Coloma Way
- 1622 Camino Way
- 1623 Carnelian Ct
- 1618 Camino Way
- 1631 Coloma Way
- 1635 Coloma Way
- 1615 Camino Way
- 1626 Carnelian Ct
- 1622 Coloma Way
- 1619 Carnelian Ct
- 716 Procter Ct
- 1642 Coloma Way
- 1639 Coloma Way
- 1618 Coloma Way
- 1627 Coloma Way