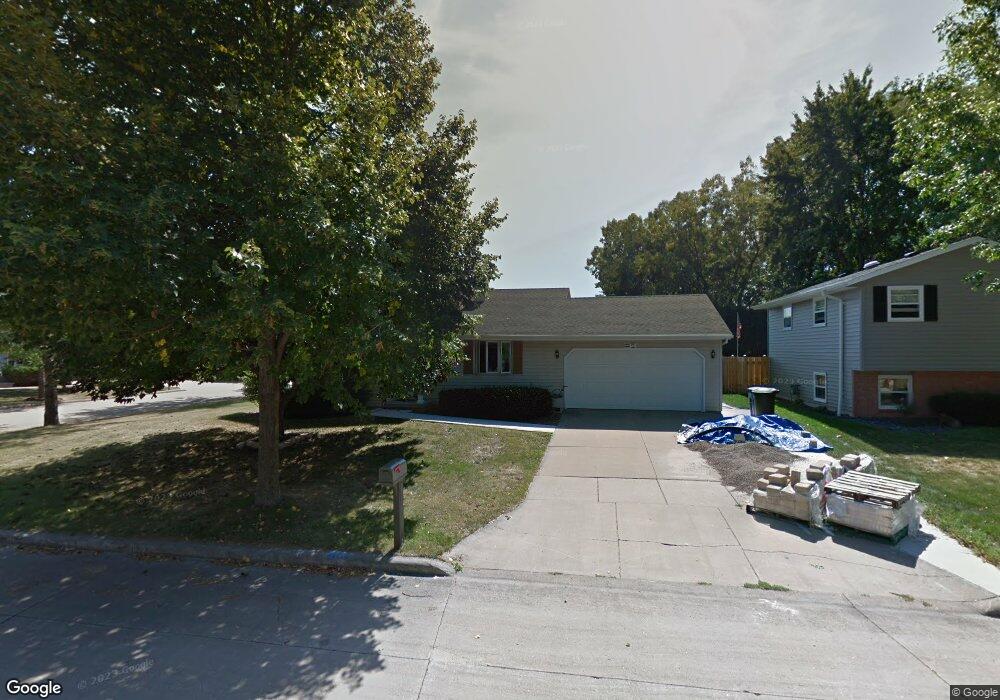
1623 E Moon Beam Trail Appleton, WI 54915
South Appleton NeighborhoodEstimated Value: $281,000 - $294,628
3
Beds
2
Baths
1,480
Sq Ft
$194/Sq Ft
Est. Value
About This Home
This home is located at 1623 E Moon Beam Trail, Appleton, WI 54915 and is currently estimated at $287,657, approximately $194 per square foot. 1623 E Moon Beam Trail is a home located in Calumet County with nearby schools including Horizons Elementary School, James Madison Middle School, and Appleton East High School.
Ownership History
Date
Name
Owned For
Owner Type
Purchase Details
Closed on
Mar 6, 2015
Sold by
Sharon Jack N
Bought by
Sharon Jack N and Evers Jessica J
Current Estimated Value
Home Financials for this Owner
Home Financials are based on the most recent Mortgage that was taken out on this home.
Original Mortgage
$80,000
Outstanding Balance
$61,181
Interest Rate
3.64%
Mortgage Type
New Conventional
Estimated Equity
$226,476
Purchase Details
Closed on
May 25, 2011
Sold by
The Michael J & Mary A Baker Living Trus
Bought by
Sharon Jack N
Home Financials for this Owner
Home Financials are based on the most recent Mortgage that was taken out on this home.
Original Mortgage
$112,716
Interest Rate
4.8%
Mortgage Type
FHA
Purchase Details
Closed on
Nov 17, 2006
Sold by
Moens Mary A
Bought by
Michael J & Mary A Baker Living Trust
Create a Home Valuation Report for This Property
The Home Valuation Report is an in-depth analysis detailing your home's value as well as a comparison with similar homes in the area
Home Values in the Area
Average Home Value in this Area
Purchase History
| Date | Buyer | Sale Price | Title Company |
|---|---|---|---|
| Sharon Jack N | $62,000 | -- | |
| Sharon Jack N | $124,000 | None Available | |
| Michael J & Mary A Baker Living Trust | -- | None Available |
Source: Public Records
Mortgage History
| Date | Status | Borrower | Loan Amount |
|---|---|---|---|
| Open | Sharon Jack N | $80,000 | |
| Closed | Sharon Jack N | $112,716 |
Source: Public Records
Tax History
| Year | Tax Paid | Tax Assessment Tax Assessment Total Assessment is a certain percentage of the fair market value that is determined by local assessors to be the total taxable value of land and additions on the property. | Land | Improvement |
|---|---|---|---|---|
| 2024 | -- | $228,400 | $42,700 | $185,700 |
| 2023 | $3,528 | $228,400 | $42,700 | $185,700 |
| 2022 | $3,372 | $158,000 | $34,600 | $123,400 |
| 2021 | $3,299 | $158,000 | $34,600 | $123,400 |
| 2020 | $3,266 | $158,000 | $34,600 | $123,400 |
| 2019 | $3,102 | $158,000 | $34,600 | $123,400 |
| 2018 | $2,881 | $132,100 | $32,500 | $99,600 |
| 2017 | $2,871 | $132,100 | $32,500 | $99,600 |
| 2016 | $2,779 | $132,100 | $32,500 | $99,600 |
| 2015 | $2,782 | $132,100 | $32,500 | $99,600 |
| 2013 | $2,666 | $126,900 | $32,500 | $94,400 |
Source: Public Records
Map
Nearby Homes
- 3200 Huckleberry Ln
- 1821 E Sylvan Ave
- 1421 E Midway Rd
- 1235 E Sylvan Ave
- 2519 S Eric Dr
- 1128 E Layton Ave
- 3608 S Berryfield Ln
- N9359 Gemstone Ct
- N9315 Gemstone Ct
- N9330 Gemstone Ct
- N9316 Gemstone Ct
- 2362 E Plank Rd Unit D
- 1548 Oneida St
- N9292 Constellation Dr
- N9272 Constellation Dr
- N9278 Constellation Dr
- N9284 Constellation Dr
- N9273 Constellation Dr
- 1237 E Calumet St
- 2503 S Harmon St
- 1615 E Moon Beam Trail
- 2911 Moon Beam Ct
- 1707 E Moon Beam Trail
- 1609 E Moon Beam Trail
- 1624 E Moon Beam Trail
- 1632 E Moon Beam Trail
- 1616 E Moon Beam Trail
- 1711 E Moon Beam Trail
- 1608 E Moon Beam Trail
- 1700 E Moon Beam Trail
- 1601 E Moon Beam Trail
- 1602 E Moon Beam Trail
- 1706 E Moon Beam Trail
- 1600 E Moon Beam Trail
- 1625 E Sylvan Ave
- 1617 E Sylvan Ave
- 1609 E Sylvan Ave
- 1601 E Sylvan Ave
- 1712 E Moon Beam Trail
- 2705 S Kernan Ave
Your Personal Tour Guide
Ask me questions while you tour the home.