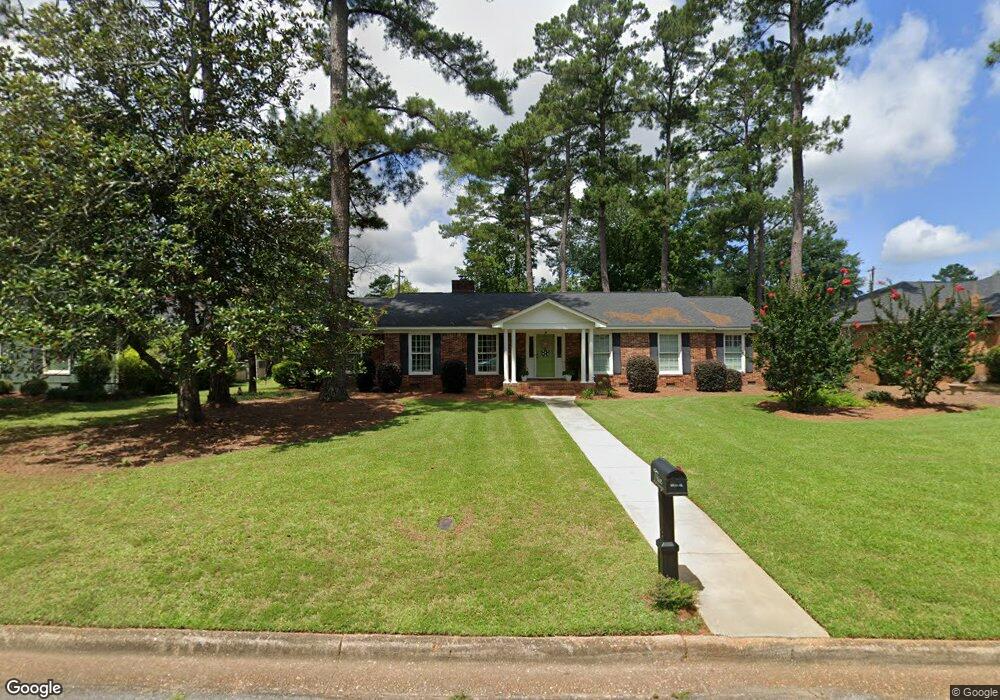
1623 N Valencia Dr Albany, GA 31707
Merry Acres NeighborhoodEstimated Value: $242,000 - $270,000
4
Beds
3
Baths
2,504
Sq Ft
$100/Sq Ft
Est. Value
About This Home
This home is located at 1623 N Valencia Dr, Albany, GA 31707 and is currently estimated at $250,793, approximately $100 per square foot. 1623 N Valencia Dr is a home located in Dougherty County with nearby schools including Live Oak Elementary School, Merry Acres Middle School, and Westover High School.
Ownership History
Date
Name
Owned For
Owner Type
Purchase Details
Closed on
Nov 17, 2022
Sold by
Trice James M
Bought by
Trice James M and Trice Shannon W
Current Estimated Value
Purchase Details
Closed on
Apr 15, 2009
Sold by
Trice James T
Bought by
Trice James T and Trice James M
Home Financials for this Owner
Home Financials are based on the most recent Mortgage that was taken out on this home.
Original Mortgage
$124,000
Interest Rate
5.01%
Mortgage Type
Future Advance Clause Open End Mortgage
Purchase Details
Closed on
Nov 11, 1997
Sold by
Collins Craig M
Bought by
Collins Craig M and Collins Keleigh S
Purchase Details
Closed on
Nov 10, 1997
Sold by
Clayton David T and Clayton Frances H
Bought by
Collins Craig M
Purchase Details
Closed on
Feb 26, 1990
Sold by
Rutherford Alan and Rutherford B
Bought by
Clayton David T and Clayton Frances H
Purchase Details
Closed on
Nov 12, 1986
Sold by
Manuel Mrs and Manuel Louisiana
Bought by
Rutherford Alan and Rutherford B
Create a Home Valuation Report for This Property
The Home Valuation Report is an in-depth analysis detailing your home's value as well as a comparison with similar homes in the area
Home Values in the Area
Average Home Value in this Area
Purchase History
| Date | Buyer | Sale Price | Title Company |
|---|---|---|---|
| Trice James M | -- | -- | |
| Trice James T | -- | -- | |
| Trice James T | $77,500 | -- | |
| Trice James T | $77,500 | -- | |
| Collins Craig M | -- | -- | |
| Collins Craig M | $120,000 | -- | |
| Clayton David T | $85,000 | -- | |
| Rutherford Alan | -- | -- |
Source: Public Records
Mortgage History
| Date | Status | Borrower | Loan Amount |
|---|---|---|---|
| Previous Owner | Trice James T | $124,000 |
Source: Public Records
Tax History Compared to Growth
Tax History
| Year | Tax Paid | Tax Assessment Tax Assessment Total Assessment is a certain percentage of the fair market value that is determined by local assessors to be the total taxable value of land and additions on the property. | Land | Improvement |
|---|---|---|---|---|
| 2024 | $3,133 | $65,680 | $7,960 | $57,720 |
| 2023 | $3,060 | $65,680 | $7,960 | $57,720 |
| 2022 | $3,071 | $65,680 | $7,960 | $57,720 |
| 2021 | $2,847 | $65,680 | $7,960 | $57,720 |
| 2020 | $2,854 | $65,680 | $7,960 | $57,720 |
| 2019 | $2,865 | $65,680 | $7,960 | $57,720 |
| 2018 | $2,877 | $65,680 | $7,960 | $57,720 |
| 2017 | $2,680 | $65,680 | $7,960 | $57,720 |
| 2016 | $2,682 | $65,680 | $7,960 | $57,720 |
| 2015 | $2,689 | $65,680 | $7,960 | $57,720 |
| 2014 | $2,696 | $66,680 | $8,960 | $57,720 |
Source: Public Records
Map
Nearby Homes
- 612 Russell Rd
- 608 Russell Rd
- 1710 Myrtle Rd
- 1821 Samford Ave
- 2026 Melrose Dr
- 1711 Parker Ave
- 410 Pinecrest Dr
- 1705 Lynwood Ln
- 2200 Gillionville Rd
- 1708 Marbury Ln
- 2021 W Broad Ave
- 00 Gillionville Rd
- 1802 W Lakeridge Dr
- 1714 Marbury Ln
- 200 N Ingleside Dr
- 600 N Ingleside Dr
- 1728 Lynwood Ln
- 1721 Lynwood Ln
- 2009 W Broad Ave
- 1814 Green Valley Ln
- 1621 N Valencia Dr
- 1625 N Valencia Dr
- 614 Russell Rd
- 616 Russell Rd
- 1619 N Valencia Dr
- 1627 N Valencia Dr
- 618 Russell Rd
- 1622 N Valencia Dr
- 1620 N Valencia Dr
- 1624 N Valencia Dr
- 606 Russell Rd
- 1618 N Valencia Dr
- 620 Russell Rd
- 1626 N Valencia Dr
- 1617 N Valencia Dr
- 617 Russell Rd
- 1616 N Valencia Dr
- 622 Russell Rd
- 1629 N Valencia Dr
- 619 Russell Rd