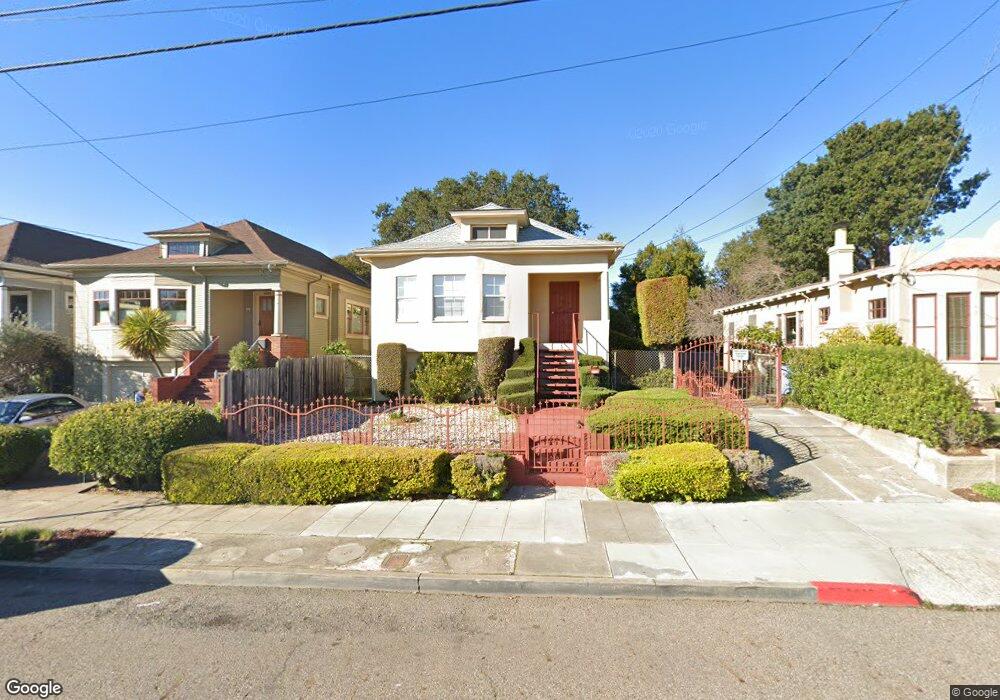
1623 Tyler St Berkeley, CA 94703
South Berkeley NeighborhoodEstimated Value: $1,087,000 - $1,438,164
4
Beds
2
Baths
1,390
Sq Ft
$958/Sq Ft
Est. Value
About This Home
This home is located at 1623 Tyler St, Berkeley, CA 94703 and is currently estimated at $1,332,041, approximately $958 per square foot. 1623 Tyler St is a home located in Alameda County with nearby schools including Malcolm X Elementary School, Emerson Elementary School, and John Muir Elementary School.
Ownership History
Date
Name
Owned For
Owner Type
Purchase Details
Closed on
May 3, 2023
Sold by
Campbell John R
Bought by
Jack And Diane Campbell Trust and Campbell
Current Estimated Value
Purchase Details
Closed on
Dec 4, 2019
Sold by
Reed Bryan Edward and Zilla Z Robinson Revocable Tru
Bought by
Campbell John R
Purchase Details
Closed on
Jul 5, 2000
Sold by
Robinson Zilla Z
Bought by
Robinson Zilla Z and Zilla Z Robinson Living Trust
Create a Home Valuation Report for This Property
The Home Valuation Report is an in-depth analysis detailing your home's value as well as a comparison with similar homes in the area
Home Values in the Area
Average Home Value in this Area
Purchase History
| Date | Buyer | Sale Price | Title Company |
|---|---|---|---|
| Jack And Diane Campbell Trust | -- | None Listed On Document | |
| Campbell John R | $1,300,000 | First American Title Company | |
| Robinson Zilla Z | -- | -- |
Source: Public Records
Tax History
| Year | Tax Paid | Tax Assessment Tax Assessment Total Assessment is a certain percentage of the fair market value that is determined by local assessors to be the total taxable value of land and additions on the property. | Land | Improvement |
|---|---|---|---|---|
| 2025 | $20,742 | $1,421,719 | $546,815 | $874,904 |
| 2024 | $20,742 | $1,393,847 | $536,095 | $857,752 |
| 2023 | $20,271 | $1,366,521 | $525,585 | $840,936 |
| 2022 | $19,888 | $1,339,728 | $515,280 | $824,448 |
| 2021 | $19,963 | $1,313,468 | $505,180 | $808,288 |
| 2020 | $19,327 | $1,300,000 | $500,000 | $800,000 |
| 2019 | $3,364 | $46,493 | $24,108 | $22,385 |
| 2018 | $3,249 | $45,582 | $23,636 | $21,946 |
| 2017 | $3,100 | $44,688 | $23,172 | $21,516 |
| 2016 | $2,865 | $43,812 | $22,718 | $21,094 |
| 2015 | $2,797 | $43,154 | $22,377 | $20,777 |
| 2014 | $2,666 | $42,308 | $21,938 | $20,370 |
Source: Public Records
Map
Nearby Homes
- 1646 Ashby Ave
- 3033 Ellis St Unit B
- 2926 Ellis St
- 3114 California St
- 1535 Julia St
- 1507 Prince St
- 3138 California St
- 3101 Sacramento St
- 2829 California St
- 2922 Stanton St
- 3233 Ellis St
- 3224 Sacramento St
- 2790 Sacramento St
- 2782 Sacramento St
- 2774 Sacramento St
- 2758 Sacramento St
- 2750 Sacramento St
- 1450 Ward St
- 1314 Ashby Ave
- 2701 Grant St
Your Personal Tour Guide
Ask me questions while you tour the home.