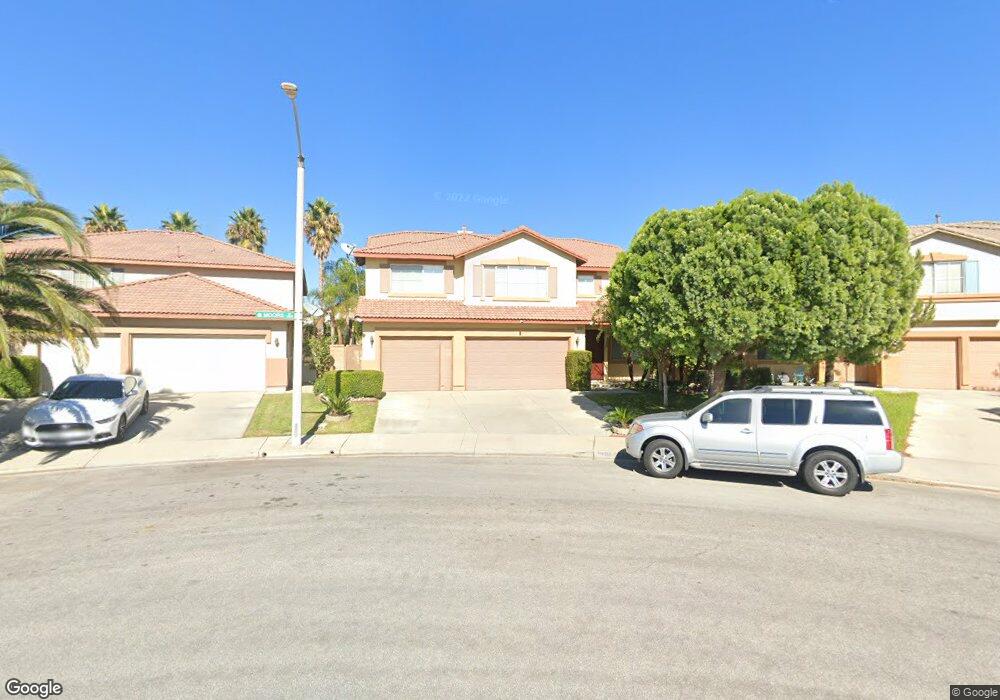
16232 Moors Ln Fontana, CA 92336
Sierra Lakes NeighborhoodEstimated Value: $846,331 - $890,000
4
Beds
3
Baths
3,683
Sq Ft
$237/Sq Ft
Est. Value
About This Home
This home is located at 16232 Moors Ln, Fontana, CA 92336 and is currently estimated at $871,083, approximately $236 per square foot. 16232 Moors Ln is a home located in San Bernardino County with nearby schools including Sierra Lakes Elementary School, Wayne Ruble Middle School, and Summit High School.
Ownership History
Date
Name
Owned For
Owner Type
Purchase Details
Closed on
Jul 14, 2025
Sold by
Obakhume Shaibu O and Obakhume Chinyere A
Bought by
Obakhume
Current Estimated Value
Purchase Details
Closed on
Sep 22, 2006
Sold by
Obakhume Shaibu O and Obakhume Chinyere A
Bought by
Obakhume Shaibu O and Obakhume Chinyere A
Home Financials for this Owner
Home Financials are based on the most recent Mortgage that was taken out on this home.
Original Mortgage
$100,000
Interest Rate
6.53%
Mortgage Type
New Conventional
Purchase Details
Closed on
Aug 14, 2002
Sold by
Kb Home Greater Los Angeles
Bought by
Obakhume Shaibu Onogimesike and Obakhume Chinyere Anthonia
Home Financials for this Owner
Home Financials are based on the most recent Mortgage that was taken out on this home.
Original Mortgage
$321,696
Interest Rate
6.37%
Create a Home Valuation Report for This Property
The Home Valuation Report is an in-depth analysis detailing your home's value as well as a comparison with similar homes in the area
Home Values in the Area
Average Home Value in this Area
Purchase History
| Date | Buyer | Sale Price | Title Company |
|---|---|---|---|
| Obakhume | -- | None Listed On Document | |
| Obakhume Shaibu O | -- | Fidelity Nationaltitle | |
| Obakhume Shaibu Onogimesike | $338,000 | First American Title Ins Co |
Source: Public Records
Mortgage History
| Date | Status | Borrower | Loan Amount |
|---|---|---|---|
| Previous Owner | Obakhume Shaibu O | $100,000 | |
| Previous Owner | Obakhume Shaibu Onogimesike | $321,696 |
Source: Public Records
Tax History Compared to Growth
Tax History
| Year | Tax Paid | Tax Assessment Tax Assessment Total Assessment is a certain percentage of the fair market value that is determined by local assessors to be the total taxable value of land and additions on the property. | Land | Improvement |
|---|---|---|---|---|
| 2025 | $8,131 | $503,821 | $122,611 | $381,210 |
| 2024 | $8,131 | $493,942 | $120,207 | $373,735 |
| 2023 | $7,536 | $484,257 | $117,850 | $366,407 |
| 2022 | $7,512 | $474,762 | $115,539 | $359,223 |
| 2021 | $7,423 | $465,453 | $113,274 | $352,179 |
| 2020 | $7,567 | $460,681 | $112,113 | $348,568 |
| 2019 | $7,403 | $451,648 | $109,915 | $341,733 |
| 2018 | $7,478 | $442,792 | $107,760 | $335,032 |
| 2017 | $7,400 | $434,110 | $105,647 | $328,463 |
| 2016 | $7,327 | $425,598 | $103,575 | $322,023 |
| 2015 | $7,323 | $419,205 | $102,019 | $317,186 |
| 2014 | $7,291 | $410,994 | $100,021 | $310,973 |
Source: Public Records
Map
Nearby Homes
- 5585 Bella Way
- 5580 Bertini Way
- 16079 Montenegro Ln
- Residence 1650 Plan at Citrus & Summit
- Residence 1914 Plan at Citrus & Summit
- Residence 1805 Plan at Citrus & Summit
- 16056 Montenegro Ln
- 16054 Montenegro Ln
- 16051 Montenegro Ln
- 16052 Montenegro Ln
- 5327 La Bodega Way
- 5611 Scharf Ave
- 15992 Jamie Ln Unit 8
- 15686 Iron Spring Ln
- 15841 Snowy Peak Ln
- 0 Walnut Unit EV22189630
- 6158 Bel Air Dr
- 16369 Medinah St
- 5367 Heitz Way
- 16540 Monteviejo St
- 16236 Moors Ln
- 16226 Moors Ln
- 16247 Seminole Way
- 16257 Seminole Way
- 16237 Seminole Way
- 16218 Moors Ln
- 5779 Boca Raton Way
- 16263 Seminole Way
- 16227 Seminole Way
- 5783 Boca Raton Way
- 16269 Seminole Way
- 16204 Moors Ln
- 16208 Moors Ln
- 16219 Seminole Way
- 5786 Boca Raton Way
- 5789 Boca Raton Way
- 5792 Boca Raton Way
- 5797 Boca Raton Way
- 5736 Perdido Bay Ct
- 5743 Perdido Bay Ct