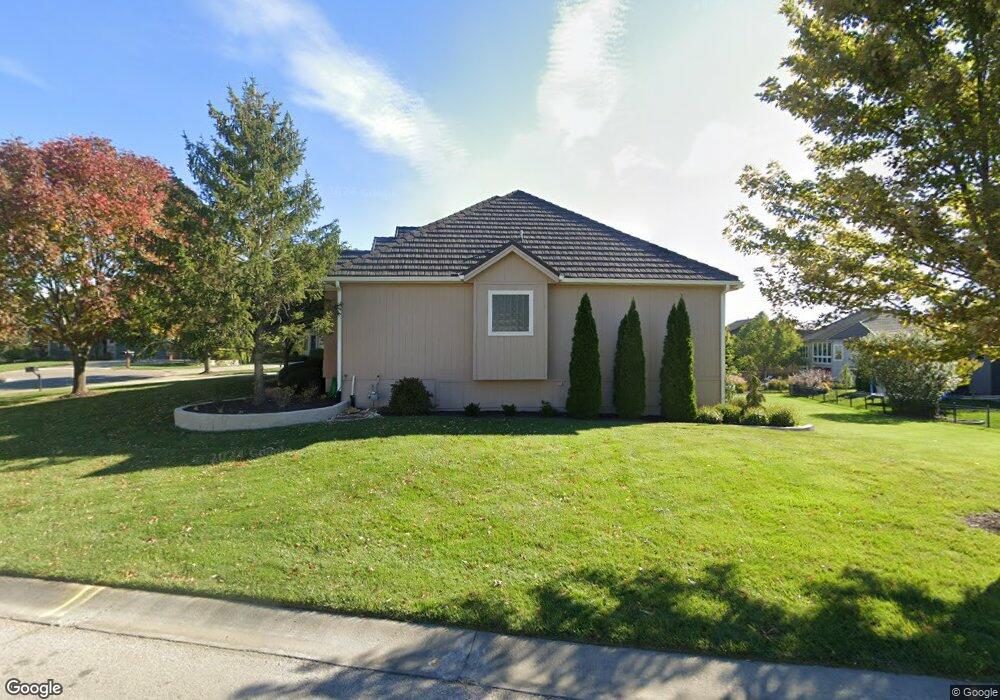
16237 Overbrook Ln Stilwell, KS 66085
Estimated Value: $677,168 - $723,000
4
Beds
4
Baths
3,063
Sq Ft
$229/Sq Ft
Est. Value
About This Home
This home is located at 16237 Overbrook Ln, Stilwell, KS 66085 and is currently estimated at $701,042, approximately $228 per square foot. 16237 Overbrook Ln is a home located in Johnson County with nearby schools including Blue River Elementary School, Blue Valley Middle School, and Blue Valley High School.
Ownership History
Date
Name
Owned For
Owner Type
Purchase Details
Closed on
Jun 10, 2025
Sold by
Morris Robert L and Morris Diane E
Bought by
Robert L Morris And Diane E Morris Co-Grantor and Morris
Current Estimated Value
Purchase Details
Closed on
Feb 13, 2008
Sold by
Jack Southerland Custom Homes Inc
Bought by
Morris Robert L and Morris Diane E
Home Financials for this Owner
Home Financials are based on the most recent Mortgage that was taken out on this home.
Original Mortgage
$285,000
Interest Rate
5.88%
Mortgage Type
New Conventional
Purchase Details
Closed on
Apr 7, 2004
Sold by
Wrs Inc
Bought by
Jack Southerland Custom Homes Inc
Home Financials for this Owner
Home Financials are based on the most recent Mortgage that was taken out on this home.
Original Mortgage
$400,350
Interest Rate
5.57%
Mortgage Type
Construction
Create a Home Valuation Report for This Property
The Home Valuation Report is an in-depth analysis detailing your home's value as well as a comparison with similar homes in the area
Home Values in the Area
Average Home Value in this Area
Purchase History
| Date | Buyer | Sale Price | Title Company |
|---|---|---|---|
| Robert L Morris And Diane E Morris Co-Grantor | -- | None Listed On Document | |
| Morris Robert L | -- | First American Title Ins Co | |
| Jack Southerland Custom Homes Inc | -- | Columbian Title Of Johnson C |
Source: Public Records
Mortgage History
| Date | Status | Borrower | Loan Amount |
|---|---|---|---|
| Previous Owner | Morris Robert L | $285,000 | |
| Previous Owner | Jack Southerland Custom Homes Inc | $400,350 |
Source: Public Records
Tax History Compared to Growth
Tax History
| Year | Tax Paid | Tax Assessment Tax Assessment Total Assessment is a certain percentage of the fair market value that is determined by local assessors to be the total taxable value of land and additions on the property. | Land | Improvement |
|---|---|---|---|---|
| 2024 | $6,695 | $65,113 | $14,681 | $50,432 |
| 2023 | $6,858 | $65,481 | $12,765 | $52,716 |
| 2022 | $6,631 | $61,870 | $12,765 | $49,105 |
| 2021 | $6,630 | $58,386 | $12,765 | $45,621 |
| 2020 | $6,880 | $59,398 | $10,570 | $48,828 |
| 2019 | $7,151 | $60,168 | $10,570 | $49,598 |
| 2018 | $6,791 | $56,063 | $10,066 | $45,997 |
| 2017 | $6,919 | $55,970 | $8,757 | $47,213 |
| 2016 | $6,631 | $53,567 | $8,757 | $44,810 |
| 2015 | $6,575 | $52,440 | $9,427 | $43,013 |
| 2013 | -- | $48,703 | $9,427 | $39,276 |
Source: Public Records
Map
Nearby Homes
- 114 Wolsey Bridge Pkwy
- 16505 MacAllister Ct
- 2628 W 162nd Terrace
- 16313 Turnberry
- 16201 Spyglass Ct
- 16140 Canterbury Rd
- 1950 Wallace Way
- 16940 S Stonehaven Dr
- 107 E 165th St
- 16917 Wallace Way
- 16931 S Highland Ridge Dr
- 15801 Canterbury St
- 16860 Highland Ridge N A
- 304 E 164th Terrace
- 16849 S Highland Ridge Dr
- 360 E Loch Lloyd Pkwy
- 18605 Reinhardt St
- 18612 Reinhardt St
- 16813 S Highland Ridge Dr
- 608 St James Ct
- 16223 Overbrook Ln
- 2150 W 162nd Terrace
- 16246 Overbrook Ln
- 16234 Overbrook Ln
- 2066 W 162nd Terrace
- 16260 Overbrook Ln
- 16211 Overbrook Ln
- 16222 Overbrook Ln
- 16232 Cambridge Dr
- 16232 Cambridge St
- 16199 Overbrook Ln
- 2044 W 162nd Terrace
- 16198 Overbrook Ln
- 2182 W 162nd Terrace
- 16214 Cambridge St
- 16214 Cambridge Dr
- 16260 Cambridge Dr
- 2099 W 162nd Terrace
- 16177 Overbrook Ln
- 2171 W 162nd Terrace