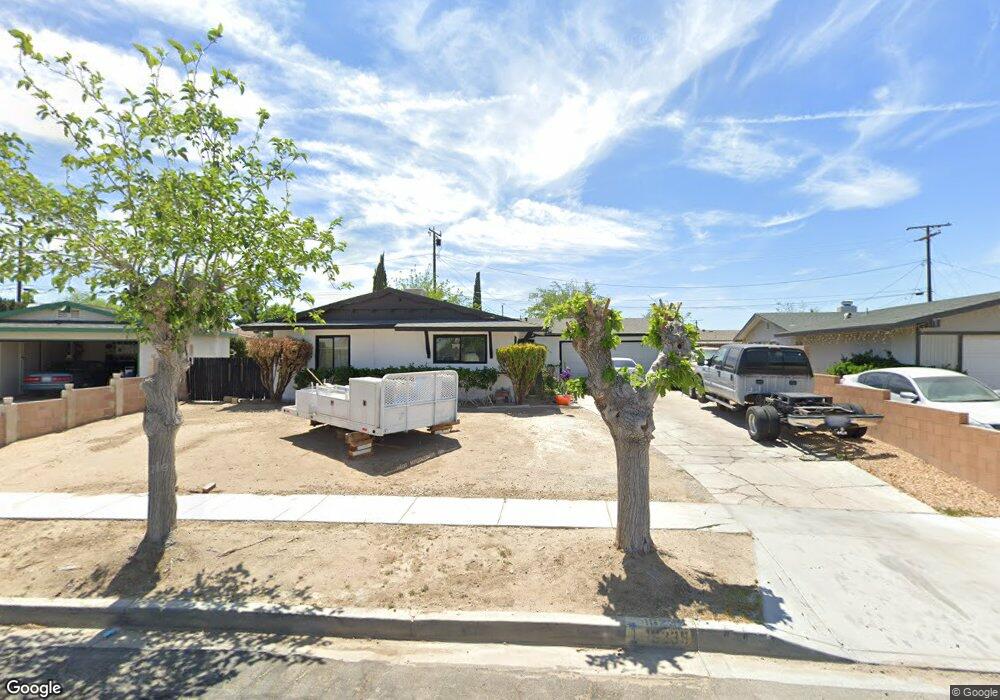
16239 Avalon Ave Victorville, CA 92395
Estimated Value: $351,000 - $370,000
3
Beds
2
Baths
1,288
Sq Ft
$282/Sq Ft
Est. Value
About This Home
This home is located at 16239 Avalon Ave, Victorville, CA 92395 and is currently estimated at $363,483, approximately $282 per square foot. 16239 Avalon Ave is a home located in San Bernardino County with nearby schools including Del Rey Elementary School, Green Tree East Elementary School, and Lakeview Leadership Academy.
Ownership History
Date
Name
Owned For
Owner Type
Purchase Details
Closed on
May 18, 2009
Sold by
Munoz Saul Daniel
Bought by
Munoz Sesilia
Current Estimated Value
Purchase Details
Closed on
Mar 17, 2009
Sold by
Aurora Loan Services Llc
Bought by
Munoz Sesilia
Home Financials for this Owner
Home Financials are based on the most recent Mortgage that was taken out on this home.
Original Mortgage
$42,750
Interest Rate
4.82%
Mortgage Type
Purchase Money Mortgage
Purchase Details
Closed on
Dec 9, 2008
Sold by
Medina Gabriela Ciriaco
Bought by
Aurora Loan Services Llc
Purchase Details
Closed on
Dec 14, 2005
Sold by
Rothschild Joyce L
Bought by
Medina Gabriela Ciriaco
Home Financials for this Owner
Home Financials are based on the most recent Mortgage that was taken out on this home.
Original Mortgage
$251,750
Interest Rate
9.9%
Mortgage Type
Purchase Money Mortgage
Create a Home Valuation Report for This Property
The Home Valuation Report is an in-depth analysis detailing your home's value as well as a comparison with similar homes in the area
Home Values in the Area
Average Home Value in this Area
Purchase History
| Date | Buyer | Sale Price | Title Company |
|---|---|---|---|
| Munoz Sesilia | -- | Lsi Title Company | |
| Munoz Sesilia | $57,000 | Lsi Title Company | |
| Aurora Loan Services Llc | $96,888 | Accommodation | |
| Medina Gabriela Ciriaco | $265,000 | Chicago Title Company |
Source: Public Records
Mortgage History
| Date | Status | Borrower | Loan Amount |
|---|---|---|---|
| Previous Owner | Munoz Sesilia | $42,750 | |
| Previous Owner | Medina Gabriela Ciriaco | $251,750 |
Source: Public Records
Tax History Compared to Growth
Tax History
| Year | Tax Paid | Tax Assessment Tax Assessment Total Assessment is a certain percentage of the fair market value that is determined by local assessors to be the total taxable value of land and additions on the property. | Land | Improvement |
|---|---|---|---|---|
| 2025 | $881 | $73,404 | $15,453 | $57,951 |
| 2024 | $881 | $71,965 | $15,150 | $56,815 |
| 2023 | $870 | $70,554 | $14,853 | $55,701 |
| 2022 | $854 | $69,171 | $14,562 | $54,609 |
| 2021 | $838 | $67,814 | $14,276 | $53,538 |
| 2020 | $822 | $67,119 | $14,130 | $52,989 |
| 2019 | $809 | $65,803 | $13,853 | $51,950 |
| 2018 | $861 | $64,512 | $13,581 | $50,931 |
| 2017 | $844 | $63,247 | $13,315 | $49,932 |
| 2016 | $827 | $62,007 | $13,054 | $48,953 |
| 2015 | $798 | $61,076 | $12,858 | $48,218 |
| 2014 | $783 | $59,879 | $12,606 | $47,273 |
Source: Public Records
Map
Nearby Homes
- 15728 La Paz Dr
- 16249 Encina St
- 15699 La Verida Dr
- 16301 Laguna St
- 16297 Pepper Tree Dr
- 0 Green Hill Dr Unit OC24001536
- 0 Green Hill Dr Unit OC24001883
- 0 Green Hill Dr Unit OC24001920
- 101 Pepper Tree Dr
- 16299 Pepper Tree Dr
- 15700 Fresno Ct
- 16011 Coronado Dr
- 15960 Green Hill Dr
- 16098 Tawney Ridge Ln
- 16277 Puesta Del Sol Dr
- 16079 Tawney Ridge Ln
- 0 Barranca Way Unit PW25106825
- 0 Barranca Way Unit PW25106858
- 16134 Colina St
- 16028 Green Hill Dr
- 16227 Avalon Ave
- 16247 Avalon Ave
- 16226 Encina St
- 16238 Encina St
- 16216 Encina St
- 16257 Avalon Ave
- 15755 La Paz Dr
- 16250 Encina St
- 15851 La Paz Dr
- 15733 La Paz Dr
- 16140 Avalon Ave
- 16260 Encina St
- 16269 Avalon Ave
- 16154 Avalon Ave
- 15785 La Paz Dr
- 16166 Avalon Ave
- 16272 Encina St
- 15744 La Verida Dr
- 16221 Encina St
- 15789 La Paz Dr