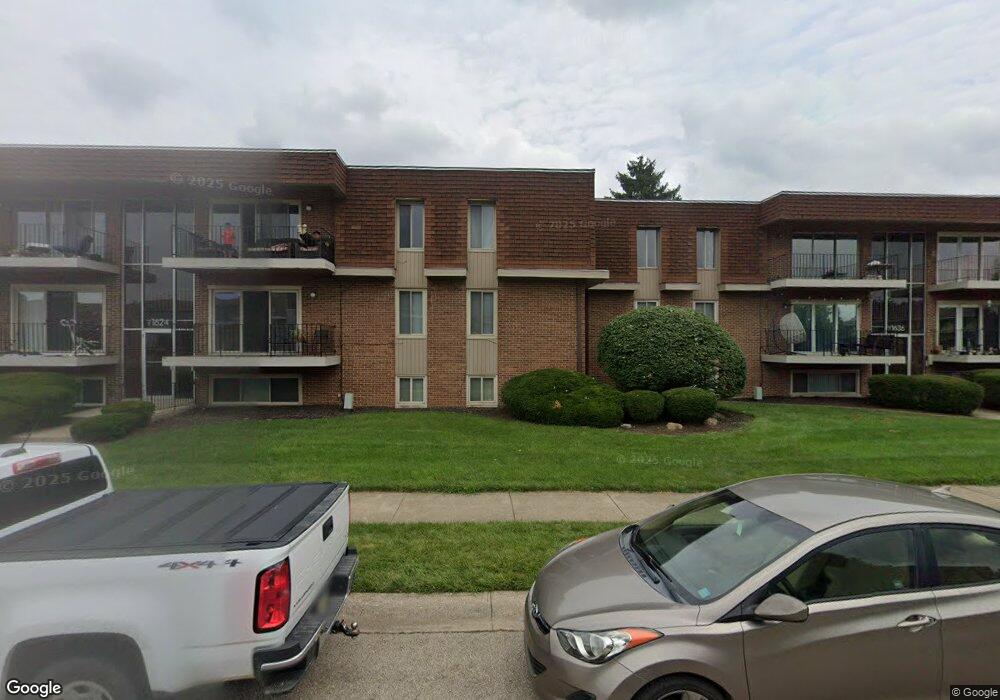
1624 Mars Hill Dr Unit B15 Dayton, OH 45449
Estimated Value: $84,351 - $120,000
3
Beds
2
Baths
1,200
Sq Ft
$85/Sq Ft
Est. Value
About This Home
This home is located at 1624 Mars Hill Dr Unit B15, Dayton, OH 45449 and is currently estimated at $102,588, approximately $85 per square foot. 1624 Mars Hill Dr Unit B15 is a home located in Montgomery County with nearby schools including West Carrollton High School, Miami Valley Academies, and Bishop Leibold School.
Ownership History
Date
Name
Owned For
Owner Type
Purchase Details
Closed on
May 10, 2023
Sold by
Montgomery County Cu Inc
Bought by
Mccann Robert M
Current Estimated Value
Purchase Details
Closed on
Sep 22, 2000
Sold by
Ashley Beverly A
Bought by
Sarsgard Robert L
Home Financials for this Owner
Home Financials are based on the most recent Mortgage that was taken out on this home.
Original Mortgage
$33,600
Interest Rate
7.8%
Mortgage Type
Balloon
Purchase Details
Closed on
May 19, 2000
Sold by
Development Secretary Of Housing And Urban
Bought by
Ashley Beverly A
Home Financials for this Owner
Home Financials are based on the most recent Mortgage that was taken out on this home.
Original Mortgage
$23,100
Interest Rate
8.64%
Purchase Details
Closed on
Oct 19, 1999
Sold by
Peyton Rickey D
Bought by
Hud
Purchase Details
Closed on
Aug 6, 1996
Sold by
Hayde Michael E and Dickson Allan M
Bought by
Peyton Rickey D and Peyton Connie S
Create a Home Valuation Report for This Property
The Home Valuation Report is an in-depth analysis detailing your home's value as well as a comparison with similar homes in the area
Home Values in the Area
Average Home Value in this Area
Purchase History
| Date | Buyer | Sale Price | Title Company |
|---|---|---|---|
| Mccann Robert M | $68,200 | None Listed On Document | |
| Sarsgard Robert L | $42,000 | -- | |
| Ashley Beverly A | $33,000 | Contract Processing & Title | |
| Hud | $38,000 | -- | |
| Peyton Rickey D | $41,000 | -- |
Source: Public Records
Mortgage History
| Date | Status | Borrower | Loan Amount |
|---|---|---|---|
| Previous Owner | Sarsgard Robert L | $33,600 | |
| Previous Owner | Ashley Beverly A | $23,100 |
Source: Public Records
Tax History Compared to Growth
Tax History
| Year | Tax Paid | Tax Assessment Tax Assessment Total Assessment is a certain percentage of the fair market value that is determined by local assessors to be the total taxable value of land and additions on the property. | Land | Improvement |
|---|---|---|---|---|
| 2024 | $1,047 | $18,040 | $4,060 | $13,980 |
| 2023 | $1,047 | $18,040 | $4,060 | $13,980 |
| 2022 | $1,139 | $14,290 | $3,220 | $11,070 |
| 2021 | $1,141 | $14,290 | $3,220 | $11,070 |
| 2020 | $1,141 | $14,290 | $3,220 | $11,070 |
| 2019 | $1,330 | $15,460 | $2,800 | $12,660 |
| 2018 | $1,405 | $15,460 | $2,800 | $12,660 |
| 2017 | $1,240 | $15,460 | $2,800 | $12,660 |
| 2016 | $1,269 | $15,460 | $2,800 | $12,660 |
| 2015 | $1,168 | $15,460 | $2,800 | $12,660 |
| 2014 | $1,168 | $15,460 | $2,800 | $12,660 |
| 2012 | -- | $14,830 | $3,920 | $10,910 |
Source: Public Records
Map
Nearby Homes
- 1644 Villa Dr S
- 3510 Cherry Point Way
- 3495 Cottage Point Way
- 6125 Teagarden Cir
- 6175 Carnation Rd
- 6330 Pine Cone Dr
- 6102 Rivercliff Ln
- 6481 Pine Cone Dr
- 5924 Jassamine Dr
- 6411 Blossom Park Dr
- 354 Ellenwood Dr
- 430 Donington Dr
- 330 Ellenwood Dr
- 2854 Eckley Blvd
- 5963 Cindy Dr
- 2734 Orchard Run Rd Unit 49 Fox Hill Condo Se
- 1320 S Alex Rd
- 6560 Springboro Pike
- 2618 Marigold Dr
- 2700 Eckley Blvd
- 1624 Mars Hill Dr Unit D
- 1624 Mars Hill Dr Unit B18
- 1624 Mars Hill Dr Unit B17
- 1624 Mars Hill Dr Unit B16
- 1624 Mars Hill Dr Unit B14
- 1624 Mars Hill Dr Unit B13
- 1624 Mars Hill Dr Unit F
- 1636 Mars Hill Dr Unit B24
- 1636 Mars Hill Dr Unit B23
- 1636 Mars Hill Dr Unit B22
- 1636 Mars Hill Dr Unit B21
- 1636 Mars Hill Dr Unit B20
- 1636 Mars Hill Dr Unit B19
- 1636 Mars Hill Dr Unit B
- 1636 Mars Hill Dr Unit C
- 1636 Mars Hill Dr Unit B-1
- 1636 Mars Hill Dr Unit D
- 1612 Mars Hill Dr Unit A12
- 1612 Mars Hill Dr Unit A11
- 1612 Mars Hill Dr Unit A10