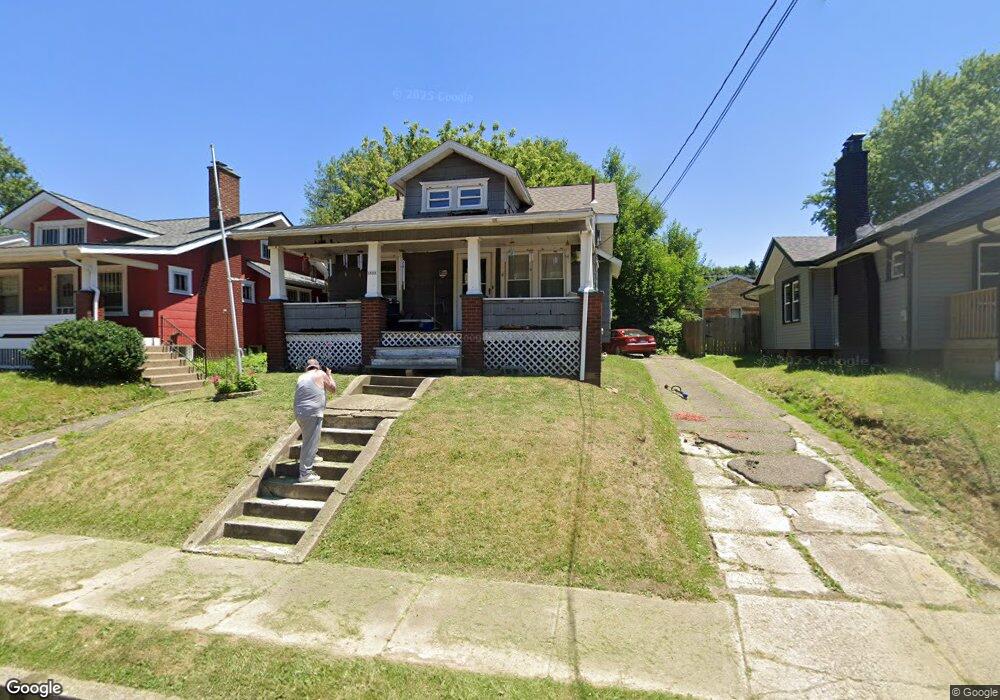
1624 Miami Ct NE Canton, OH 44714
Gibbs Area NeighborhoodEstimated Value: $77,201 - $104,000
4
Beds
1
Bath
1,278
Sq Ft
$71/Sq Ft
Est. Value
About This Home
This home is located at 1624 Miami Ct NE, Canton, OH 44714 and is currently estimated at $90,800, approximately $71 per square foot. 1624 Miami Ct NE is a home located in Stark County with nearby schools including Early Learning Center @ Schreiber, Gibbs Elementary School, and Youtz Intermediate School.
Ownership History
Date
Name
Owned For
Owner Type
Purchase Details
Closed on
Aug 26, 2024
Sold by
Filliez Steven and Filliez Stephen D
Bought by
Premier Homes Inc
Current Estimated Value
Purchase Details
Closed on
Jan 7, 2010
Sold by
Consumers National Bank
Bought by
Filliez Stephen
Purchase Details
Closed on
May 18, 2009
Sold by
Jjc Investors Inc
Bought by
Consumers National Bank
Purchase Details
Closed on
Apr 4, 2005
Sold by
The Bank Of New York
Bought by
Jjc Investors Inc
Purchase Details
Closed on
Feb 2, 2005
Sold by
Becher Kathleen Mary
Bought by
The Bank Of New York and Eqcc Asset Backed Certificates Series 20
Purchase Details
Closed on
Oct 3, 2000
Sold by
Becher Emma K
Bought by
Becher Kathleen Mary
Home Financials for this Owner
Home Financials are based on the most recent Mortgage that was taken out on this home.
Original Mortgage
$26,000
Interest Rate
7.99%
Mortgage Type
Purchase Money Mortgage
Purchase Details
Closed on
May 5, 1993
Create a Home Valuation Report for This Property
The Home Valuation Report is an in-depth analysis detailing your home's value as well as a comparison with similar homes in the area
Home Values in the Area
Average Home Value in this Area
Purchase History
| Date | Buyer | Sale Price | Title Company |
|---|---|---|---|
| Premier Homes Inc | $2,730,900 | None Listed On Document | |
| Filliez Stephen | $5,000 | Heritage Union Title Co Ltd | |
| Consumers National Bank | $28,000 | Attorney | |
| Jjc Investors Inc | $28,500 | Resource Title Agency Inc | |
| The Bank Of New York | $40,000 | Resource Title Agency Inc | |
| Becher Kathleen Mary | $24,300 | -- | |
| -- | $24,300 | -- |
Source: Public Records
Mortgage History
| Date | Status | Borrower | Loan Amount |
|---|---|---|---|
| Previous Owner | Becher Kathleen Mary | $26,000 |
Source: Public Records
Tax History Compared to Growth
Tax History
| Year | Tax Paid | Tax Assessment Tax Assessment Total Assessment is a certain percentage of the fair market value that is determined by local assessors to be the total taxable value of land and additions on the property. | Land | Improvement |
|---|---|---|---|---|
| 2025 | -- | $9,560 | $2,940 | $6,620 |
| 2024 | -- | $9,560 | $2,940 | $6,620 |
| 2023 | $480 | $7,850 | $2,490 | $5,360 |
| 2022 | $470 | $7,850 | $2,490 | $5,360 |
| 2021 | $475 | $7,850 | $2,490 | $5,360 |
| 2020 | $457 | $6,760 | $2,140 | $4,620 |
| 2019 | $395 | $6,760 | $2,140 | $4,620 |
| 2018 | $830 | $10,260 | $2,140 | $8,120 |
| 2017 | $117 | $1,720 | $460 | $1,260 |
| 2016 | $305 | $1,720 | $460 | $1,260 |
| 2015 | $118 | $1,720 | $460 | $1,260 |
| 2014 | $666 | $1,760 | $460 | $1,300 |
| 2013 | $65 | $1,760 | $460 | $1,300 |
Source: Public Records
Map
Nearby Homes
- 1540 Miami Ct NE
- 802 17th St NE
- 1521 Gibbs Ave NE
- 1126 18th St NE
- 1219 17th St NE
- 1611 Rowland Ave NE
- 918 19th St NE
- 1631 Shriver Ave NE
- 1734 Rowland Ave NE
- 1454 Spring Ave NE
- 1422 Plain Ave NE
- 1412 Miami Ct NE
- 1447 Shriver Ave NE
- 1517 16th St NE
- 211 15th St NE
- 1625 Market Ave N
- 1332 Spring Ave NE
- 1322 Struble Ave NE
- 1515 Parkhill Place NE
- 0 Rowland Ave NE Unit 5089960
- 1630 Miami Ct NE
- 1620 Miami Ct NE
- 1634 Miami Ct NE
- 1616 Miami Ct NE
- 1645 Gibbs Ave NE
- 1641 Gibbs Ave NE
- 1641 Gibbs Ave NE
- 1638 Miami Ct NE
- 1612 Miami Ct NE
- 1649 Gibbs Ave NE
- 1633 Gibbs Ave NE
- 1627 Miami Ct NE
- 1621 Miami Ct NE
- 1631 Miami Ct NE
- 1629 Gibbs Ave NE
- 1642 Miami Ct NE
- 1635 Miami Ct NE
- 1639 Miami Ct NE
- 1615 Miami Ct NE
- 1659 Gibbs Ave NE