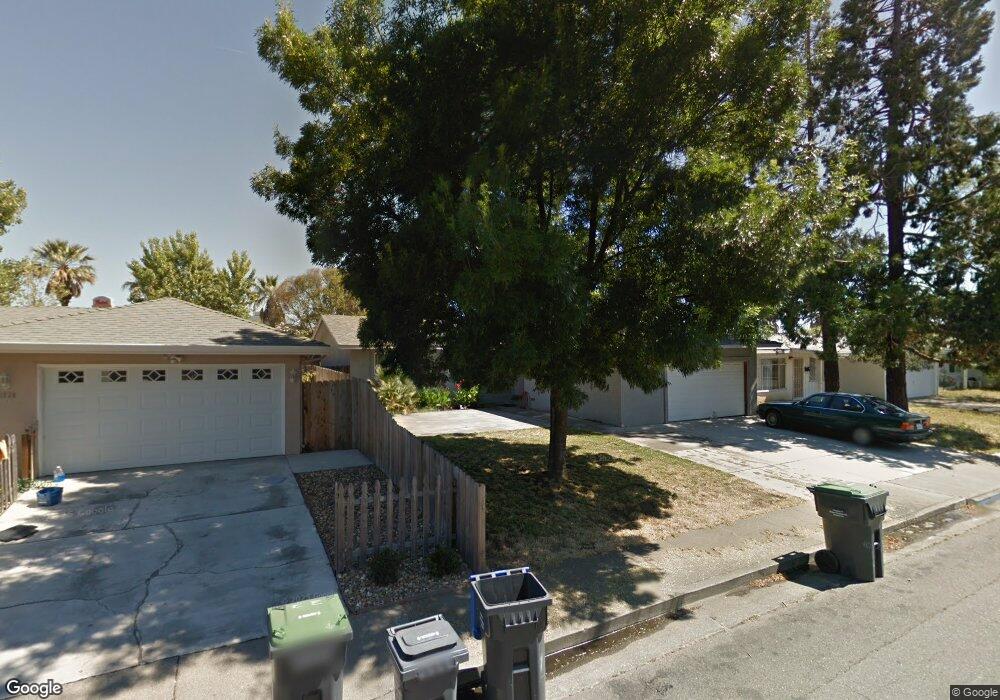
1624 Michigan St Fairfield, CA 94533
Estimated Value: $408,000 - $515,000
3
Beds
2
Baths
1,305
Sq Ft
$360/Sq Ft
Est. Value
About This Home
This home is located at 1624 Michigan St, Fairfield, CA 94533 and is currently estimated at $469,583, approximately $359 per square foot. 1624 Michigan St is a home located in Solano County with nearby schools including Fairview Elementary School, Crystal Middle School, and Armijo High School.
Ownership History
Date
Name
Owned For
Owner Type
Purchase Details
Closed on
Dec 19, 2003
Sold by
Plascencia Joe
Bought by
Plascencia Joe and Plascencia Gloria
Current Estimated Value
Home Financials for this Owner
Home Financials are based on the most recent Mortgage that was taken out on this home.
Original Mortgage
$223,750
Outstanding Balance
$104,767
Interest Rate
6.03%
Mortgage Type
New Conventional
Estimated Equity
$364,816
Purchase Details
Closed on
Dec 8, 1998
Sold by
Federal National Mortgage Association
Bought by
Plascencia Joe
Home Financials for this Owner
Home Financials are based on the most recent Mortgage that was taken out on this home.
Original Mortgage
$83,620
Interest Rate
6.86%
Mortgage Type
FHA
Purchase Details
Closed on
May 1, 1998
Sold by
Dekker William and Dekker Donna
Bought by
Federal National Mortgage Association
Create a Home Valuation Report for This Property
The Home Valuation Report is an in-depth analysis detailing your home's value as well as a comparison with similar homes in the area
Home Values in the Area
Average Home Value in this Area
Purchase History
| Date | Buyer | Sale Price | Title Company |
|---|---|---|---|
| Plascencia Joe | -- | Chicago Title Co | |
| Plascencia Joe | $73,500 | First American Title Guarant | |
| Federal National Mortgage Association | $73,000 | -- |
Source: Public Records
Mortgage History
| Date | Status | Borrower | Loan Amount |
|---|---|---|---|
| Open | Plascencia Joe | $223,750 | |
| Closed | Plascencia Joe | $83,620 |
Source: Public Records
Tax History Compared to Growth
Tax History
| Year | Tax Paid | Tax Assessment Tax Assessment Total Assessment is a certain percentage of the fair market value that is determined by local assessors to be the total taxable value of land and additions on the property. | Land | Improvement |
|---|---|---|---|---|
| 2025 | $1,311 | $115,212 | $47,024 | $68,188 |
| 2024 | $1,311 | $112,953 | $46,102 | $66,851 |
| 2023 | $1,272 | $110,740 | $45,199 | $65,541 |
| 2022 | $1,257 | $108,569 | $44,313 | $64,256 |
| 2021 | $1,244 | $106,442 | $43,445 | $62,997 |
| 2020 | $1,216 | $105,352 | $43,000 | $62,352 |
| 2019 | $1,186 | $103,287 | $42,157 | $61,130 |
| 2018 | $1,224 | $101,263 | $41,331 | $59,932 |
| 2017 | $1,169 | $99,278 | $40,521 | $58,757 |
| 2016 | $1,152 | $97,332 | $39,727 | $57,605 |
| 2015 | $1,076 | $95,871 | $39,131 | $56,740 |
| 2014 | $1,066 | $93,994 | $38,365 | $55,629 |
Source: Public Records
Map
Nearby Homes
- 1731 Michigan St
- 1200 Truman St
- 1661 Minnesota St
- 1443 Minnesota St
- 1842 Minnesota St
- 1007 4th St
- 2635 Alvarado Ct Unit 3
- 2724 Toland Dr
- 1042 Hayes St
- 1412 Hawaii St
- 1737 Alford Dr
- 1032 Tyler St
- 1024 Tyler St
- 1316 Lincoln St
- 3109 Burbank Dr
- 2846 Owens St
- 1737 Kearny Ct
- 2045 Dorland Dr
- 1216 Lincoln St
- 1625 Park Ln Unit 11
- 1618 Michigan St
- 1630 Michigan St
- 1612 Michigan St
- 1636 Michigan St
- 1625 Michigan St
- 1619 Michigan St
- 1631 Michigan St
- 1606 Michigan St
- 1700 Michigan St
- 1613 Michigan St
- 1637 Michigan St
- 1706 Michigan St
- 1607 Michigan St
- 1701 Michigan St
- 1600 Michigan St
- 1624 New Jersey St
- 1618 New Jersey St
- 1630 New Jersey St
- 1612 New Jersey St
- 1636 New Jersey St