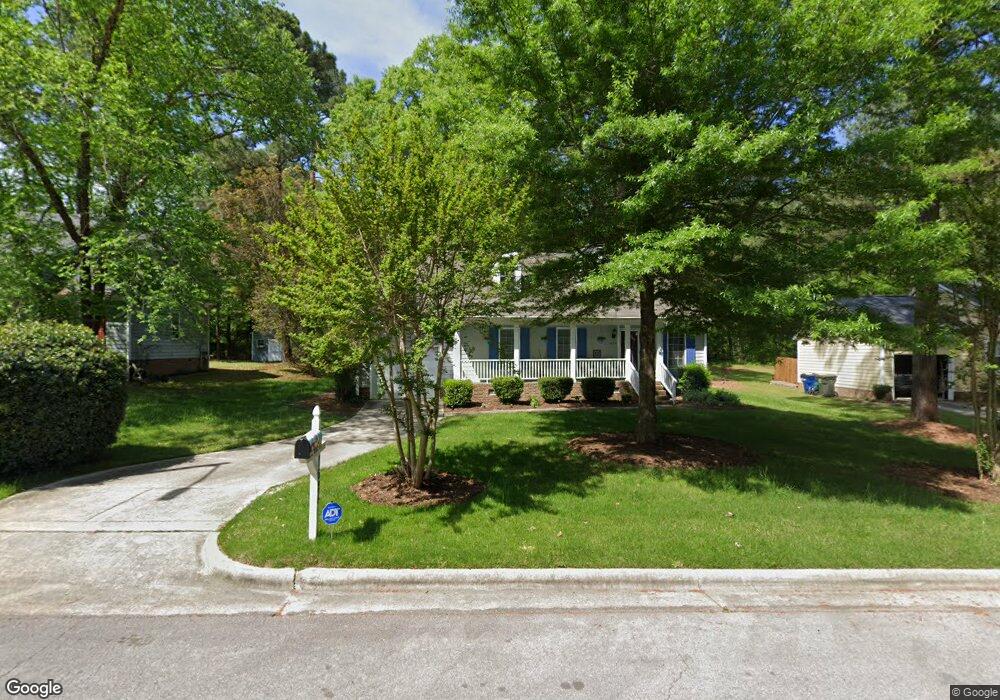
1624 Netherfield Ln Raleigh, NC 27610
Southeast Raleigh NeighborhoodEstimated Value: $308,000 - $318,058
3
Beds
2
Baths
1,432
Sq Ft
$218/Sq Ft
Est. Value
About This Home
This home is located at 1624 Netherfield Ln, Raleigh, NC 27610 and is currently estimated at $312,265, approximately $218 per square foot. 1624 Netherfield Ln is a home located in Wake County with nearby schools including Barwell Road Elementary School, Carnage Magnet Middle School, and South Garner High.
Ownership History
Date
Name
Owned For
Owner Type
Purchase Details
Closed on
Jan 6, 2015
Sold by
Gambino Anthony
Bought by
Harris Sharon W
Current Estimated Value
Home Financials for this Owner
Home Financials are based on the most recent Mortgage that was taken out on this home.
Original Mortgage
$127,775
Outstanding Balance
$98,587
Interest Rate
4.04%
Mortgage Type
New Conventional
Estimated Equity
$213,678
Purchase Details
Closed on
Jul 6, 2013
Sold by
Luma Seth Nolan and Claus Helena Mae
Bought by
Gambino Anthony
Home Financials for this Owner
Home Financials are based on the most recent Mortgage that was taken out on this home.
Original Mortgage
$123,500
Interest Rate
3.79%
Mortgage Type
New Conventional
Purchase Details
Closed on
Jun 28, 2007
Sold by
Boehm Tom P and Boehm Denna L
Bought by
Luma Seth Nolan and Luma Helena Mae
Home Financials for this Owner
Home Financials are based on the most recent Mortgage that was taken out on this home.
Original Mortgage
$142,500
Interest Rate
6.16%
Mortgage Type
Purchase Money Mortgage
Create a Home Valuation Report for This Property
The Home Valuation Report is an in-depth analysis detailing your home's value as well as a comparison with similar homes in the area
Home Values in the Area
Average Home Value in this Area
Purchase History
| Date | Buyer | Sale Price | Title Company |
|---|---|---|---|
| Harris Sharon W | $134,500 | None Available | |
| Gambino Anthony | $123,500 | None Available | |
| Luma Seth Nolan | $142,500 | None Available |
Source: Public Records
Mortgage History
| Date | Status | Borrower | Loan Amount |
|---|---|---|---|
| Open | Harris Sharon W | $127,775 | |
| Previous Owner | Gambino Anthony | $123,500 | |
| Previous Owner | Luma Seth Nolan | $142,500 |
Source: Public Records
Tax History Compared to Growth
Tax History
| Year | Tax Paid | Tax Assessment Tax Assessment Total Assessment is a certain percentage of the fair market value that is determined by local assessors to be the total taxable value of land and additions on the property. | Land | Improvement |
|---|---|---|---|---|
| 2025 | $2,686 | $305,745 | $90,000 | $215,745 |
| 2024 | $2,675 | $305,745 | $90,000 | $215,745 |
| 2023 | $2,094 | $190,316 | $40,000 | $150,316 |
| 2022 | $1,947 | $190,316 | $40,000 | $150,316 |
| 2021 | $1,872 | $190,316 | $40,000 | $150,316 |
| 2020 | $1,838 | $190,316 | $40,000 | $150,316 |
| 2019 | $1,569 | $133,626 | $30,000 | $103,626 |
| 2018 | $1,480 | $133,626 | $30,000 | $103,626 |
| 2017 | $1,410 | $133,626 | $30,000 | $103,626 |
| 2016 | $1,381 | $133,626 | $30,000 | $103,626 |
| 2015 | $1,455 | $138,548 | $29,000 | $109,548 |
| 2014 | $1,380 | $138,548 | $29,000 | $109,548 |
Source: Public Records
Map
Nearby Homes
- 1512 Maybrook Dr
- 1810 Eagle Beach Ct
- 5205 Pine Swell Way
- 1820 Eagle Beach Ct
- 4910 Blue Rock Ct
- 1220 Garden Stone Dr
- 1220 Canyon Rock Ct Unit 107
- 1211 Canyon Rock Ct Unit 103
- 1211 Canyon Rock Ct Unit 111
- 5121 Jimmy Ridge Place
- 1235 Stone Manor Dr
- 5531 Fieldcross Ct
- 5625 Fieldcross Ct
- 5602 Bringle Ct
- 2225 Walnut Ridge Ct
- 5324 Oporto Ct
- 2012 Ranch Mill Cir
- 4408 Poplar Dr
- 1009 Ridge Rock Rd
- 5601 Plum Nearly Ct
- 1620 Netherfield Ln
- 1628 Netherfield Ln
- 1616 Netherfield Ln
- 1632 Netherfield Ln
- 1063 Heritage Manor Dr
- 1067 Heritage Manor Dr
- 1625 Netherfield Ln
- 1629 Netherfield Ln
- 1621 Netherfield Ln
- 1612 Netherfield Ln
- 5209 Heelands Ct
- 1071 Heritage Manor Dr
- 1059 Heritage Manor Dr
- 1617 Netherfield Ln
- 5205 Heelands Ct
- 1701 Netherfield Ln
- 1608 Netherfield Ln
- 1075 Heritage Manor Dr
- 1704 Neath Hill Ct
- 1700 Neath Hill Ct