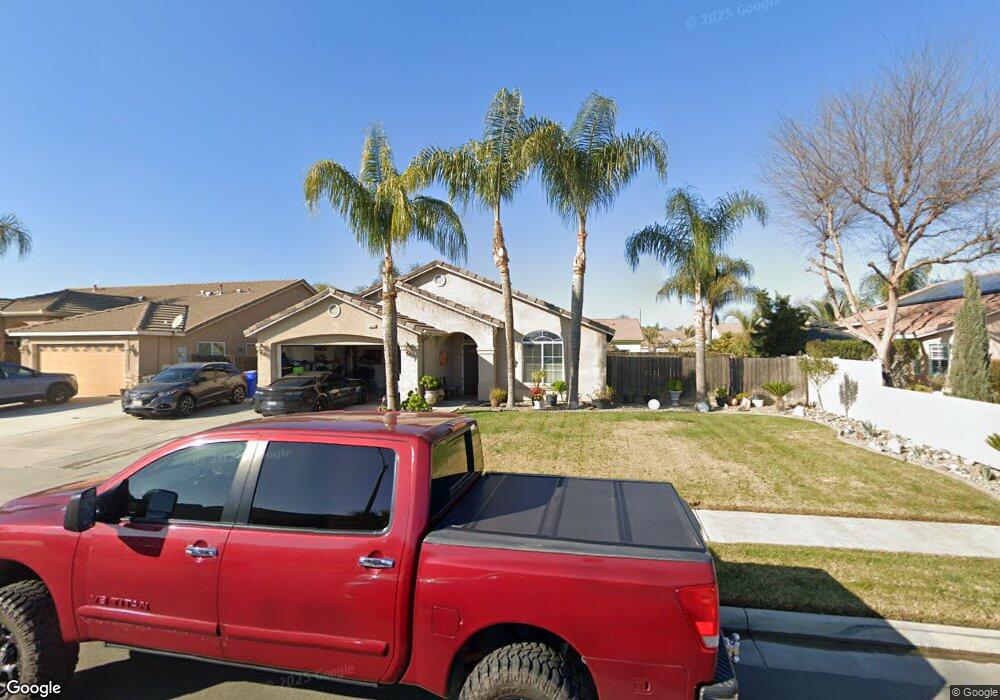
1624 Stinson Dr Lemoore, CA 93245
Estimated Value: $348,380 - $366,000
3
Beds
2
Baths
1,476
Sq Ft
$242/Sq Ft
Est. Value
About This Home
This home is located at 1624 Stinson Dr, Lemoore, CA 93245 and is currently estimated at $356,845, approximately $241 per square foot. 1624 Stinson Dr is a home located in Kings County with nearby schools including P.W. Engvall Elementary School, Liberty Middle School, and Lemoore High School.
Ownership History
Date
Name
Owned For
Owner Type
Purchase Details
Closed on
Nov 1, 2012
Sold by
Lindberg Weldon K and Lindberg Teresa L
Bought by
Casaca Vineyards
Current Estimated Value
Purchase Details
Closed on
Jan 30, 2012
Sold by
Capital Investing Llc
Bought by
Lindberg Weldon K and Lindberg Teresa L
Purchase Details
Closed on
Jan 16, 2012
Sold by
Orpia Baker Leslie Arthur and Orpia Baker Leanor
Bought by
Capital Investing Llc
Purchase Details
Closed on
Feb 15, 2005
Sold by
Daley Enterprises Inc
Bought by
Orpia Baker Leslie Arthur and Orpia Baker Leanor
Home Financials for this Owner
Home Financials are based on the most recent Mortgage that was taken out on this home.
Original Mortgage
$192,967
Interest Rate
4.75%
Mortgage Type
VA
Create a Home Valuation Report for This Property
The Home Valuation Report is an in-depth analysis detailing your home's value as well as a comparison with similar homes in the area
Home Values in the Area
Average Home Value in this Area
Purchase History
| Date | Buyer | Sale Price | Title Company |
|---|---|---|---|
| Casaca Vineyards | $155,000 | Chicago Title Company | |
| Lindberg Weldon K | $145,000 | Chicago Title Company | |
| Capital Investing Llc | $227,211 | None Available | |
| Orpia Baker Leslie Arthur | $189,000 | North American Title Company |
Source: Public Records
Mortgage History
| Date | Status | Borrower | Loan Amount |
|---|---|---|---|
| Previous Owner | Orpia Baker Leslie Arthur | $192,967 |
Source: Public Records
Tax History
| Year | Tax Paid | Tax Assessment Tax Assessment Total Assessment is a certain percentage of the fair market value that is determined by local assessors to be the total taxable value of land and additions on the property. | Land | Improvement |
|---|---|---|---|---|
| 2025 | $2,117 | $203,183 | $73,884 | $129,299 |
| 2023 | $2,117 | $195,295 | $71,016 | $124,279 |
| 2022 | $2,218 | $191,467 | $69,624 | $121,843 |
| 2021 | $2,164 | $187,713 | $68,259 | $119,454 |
| 2020 | $2,153 | $185,788 | $67,559 | $118,229 |
| 2019 | $2,136 | $182,145 | $66,234 | $115,911 |
| 2018 | $2,003 | $178,573 | $64,935 | $113,638 |
| 2017 | $2,007 | $175,072 | $63,662 | $111,410 |
| 2016 | $1,899 | $171,639 | $62,414 | $109,225 |
| 2015 | $1,891 | $169,060 | $61,476 | $107,584 |
| 2014 | $1,838 | $165,749 | $60,272 | $105,477 |
Source: Public Records
Map
Nearby Homes
- 1608 Stinson Dr
- 1644 Stinson Dr
- 1627 Capitola Ct
- 1607 Capitola Ct
- 1647 Capitola Ct
- 1588 Stinson Dr
- 1611 Stinson Dr
- 1631 Stinson Dr
- 1587 Capitola Ct
- 1595 Stinson Dr
- 1647 Stinson Dr
- 1572 Stinson Dr
- 1567 Capitola Ct
- 1575 Stinson Dr
- 775 Bodega Ave
- 752 Bodega Ave
- 1552 Stinson Dr
- 767 Bodega Ave
- 791 Bodega Ave
- 1626 Capitola Ct
Your Personal Tour Guide
Ask me questions while you tour the home.