
Seller's Agent in 2025
Adam Noe
eXp Realty, LLC - C
(919) 987-6505
4 in this area
189 Total Sales
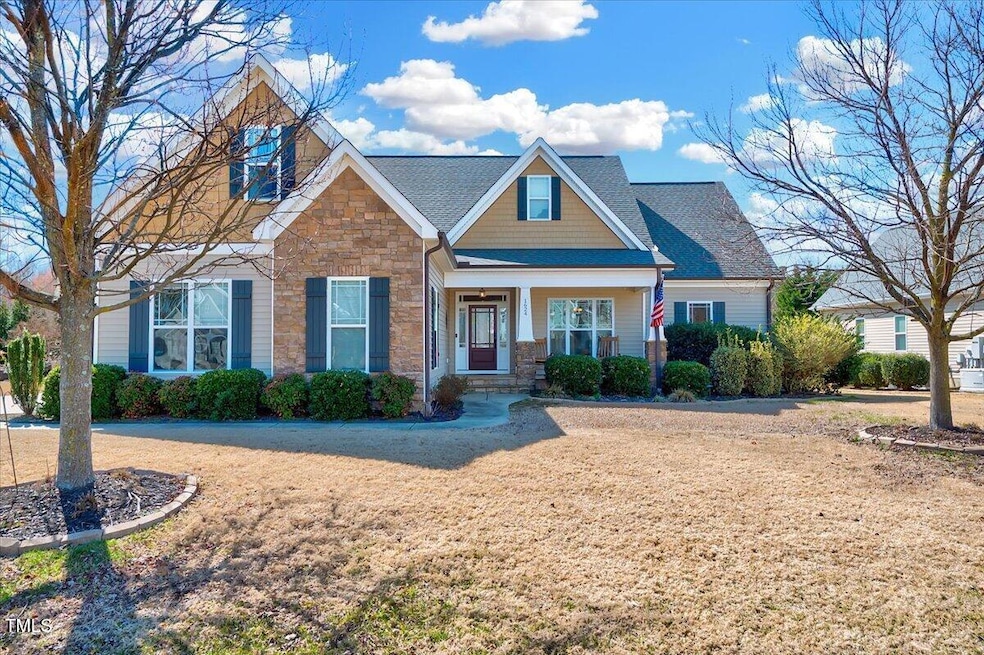
Discover the perfect balance of main-level living, modern updates, and room to grow in this beautiful 3-bedroom, 2.5-bath home located in Willow Spring's Bloomfield community. Set on a quiet street and offering over 2,600 sq ft of finished space, this property invites you to settle in and stretch out—all within minutes of Raleigh, Fuquay-Varina, and the conveniences of nearby shopping, dining, and commuter routes.
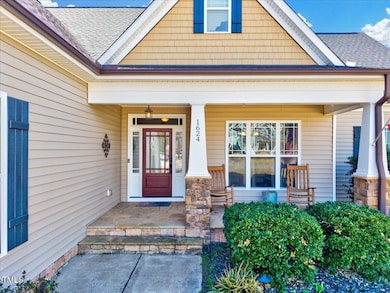
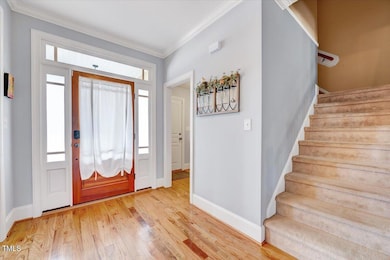
🏡 Thoughtfully Designed, Warmly Inviting
Step inside to find a flowing, open-concept layout that feels both spacious and cozy. The heart of the home features a bright living room with hardwood floors and plenty of natural light, seamlessly connecting to the kitchen and dining area for effortless everyday living.
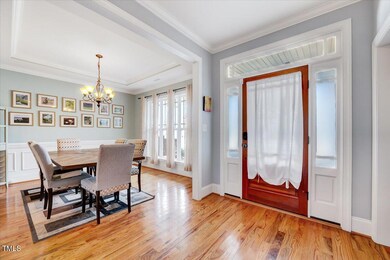
The kitchen is designed for gathering, with granite countertops, ample cabinetry, and bar seating—perfect for entertaining friends or enjoying casual meals. Nearby, a generous dining space allows for more formal hosting or holiday dinners.
🛏️ Comfortable Main-Level Living
The main floor primary suite offers a quiet retreat with plush carpet, a large walk-in closet, and a private en-suite bath featuring tile floors, dual sinks, a soaking tub, and a separate shower. Two additional bedrooms share a well-appointed full bath and are perfect for guests, children, or a home office setup.
Enjoy the ease of single-story living while still having space to dream big.
🚧 A Canvas for Expansion: 1,658 Unfinished Sq Ft Upstairs
What truly sets this home apart is the unfinished upper level—a massive 1,658 sq ft of space with plans already drawn up to help you visualize its full potential. Whether you're envisioning additional bedrooms, a bonus room, home theater, office, or studio, this area offers the freedom to grow with your needs over time.
🔧 Recent Updates for Peace of Mind
New HVAC (2024) - Enjoy year-round comfort with updated efficiency
Roof installed in 2017 - Added durability and longevity
Septic system pumped in 2023 - Well-maintained and ready for move-in
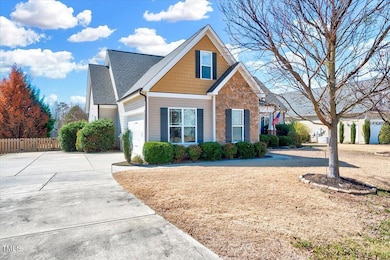
2-car garage - With plenty of room for storage or a workshop
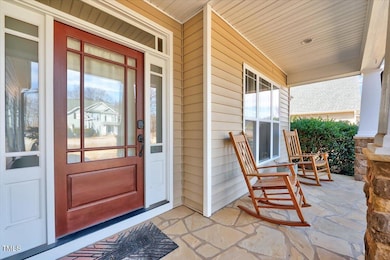
🌳 Outdoor Living & Community Perks
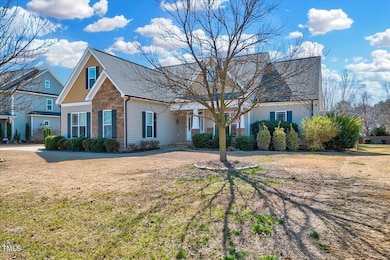
Enjoy the outdoors from your backyard oasis, offering privacy and space to garden, play, or simply relax. The friendly community features a neighborhood pool and playground—perfect for summer fun and everyday connection.
Located just minutes from downtown Fuquay-Varina, White Oak Shopping Center, and I-40, this home offers small-town charm with unbeatable access to Raleigh, RDU Airport, and nearby parks and schools.
| Date | Type | Sale Price | Title Company |
|---|---|---|---|
| Warranty Deed | $560,000 | None Listed On Document | |
| Warranty Deed | $333,000 | None Available | |
| Warranty Deed | $270,000 | None Available | |
| Warranty Deed | $43,500 | None Available |
| Date | Status | Loan Amount | Loan Type |
|---|---|---|---|
| Open | $364,500 | VA | |
| Previous Owner | $338,515 | VA | |
| Previous Owner | $215,800 | New Conventional | |
| Previous Owner | $32,625 | Construction |
| Date | Event | Price | List to Sale | Price per Sq Ft |
|---|---|---|---|---|
| 08/05/2025 08/05/25 | Sold | $560,000 | 0.0% | $215 / Sq Ft |
| 07/06/2025 07/06/25 | Pending | -- | -- | -- |
| 06/20/2025 06/20/25 | For Sale | $560,000 | -- | $215 / Sq Ft |
| Year | Tax Paid | Tax Assessment Tax Assessment Total Assessment is a certain percentage of the fair market value that is determined by local assessors to be the total taxable value of land and additions on the property. | Land | Improvement |
|---|---|---|---|---|
| 2025 | -- | $512,614 | $100,000 | $412,614 |
| 2024 | $3,203 | $512,614 | $100,000 | $412,614 |
| 2023 | $2,805 | $357,157 | $46,000 | $311,157 |
| 2022 | $2,599 | $357,157 | $46,000 | $311,157 |
| 2021 | $2,530 | $357,157 | $46,000 | $311,157 |
| 2020 | $2,488 | $357,157 | $46,000 | $311,157 |
| 2019 | $2,574 | $312,765 | $46,000 | $266,765 |
| 2018 | $1,417 | $312,765 | $46,000 | $266,765 |
| 2017 | $1,044 | $312,765 | $46,000 | $266,765 |
| 2016 | $2,198 | $312,765 | $46,000 | $266,765 |
| 2015 | $890 | $327,330 | $46,000 | $281,330 |
| 2014 | $1,000 | $327,330 | $46,000 | $281,330 |
Seller's Agent in 2025
Adam Noe
eXp Realty, LLC - C
(919) 987-6505
4 in this area
189 Total Sales
Buyer's Agent in 2025
Tanya Ireland
HODGE & KITTRELL SOTHEBYS INTE
(919) 721-8447
4 in this area
65 Total Sales
Source: Doorify MLS
MLS Number: 10104703
APN: 0686.02-86-6899-000
Disclaimer: Certain information contained herein is derived from information provided by parties other than Homes.com. All information provided is deemed reliable, but is not guaranteed to be accurate and should be independently verified.
![]() Some IDX listings have been excluded from this IDX display. Brokers make an effort to deliver accurate information, but buyers should independently verify any information on which they will rely in a transaction. The listing broker shall not be responsible for any typographical errors, misinformation, or misprints, and they shall be held totally harmless from any damages arising from reliance upon this data. This data is provided exclusively for consumers’ personal, non-commercial use. Listings marked with an icon are provided courtesy of the Doorify MLS, Inc. of North Carolina, Internet Data Exchange Database. Closed (sold) listings may have been listed and/or sold by a real estate firm other than the firm(s) featured on this website. Closed data is not available until the sale of the property is recorded in the MLS. Home sale data is not an appraisal, CMA, competitive or comparative market analysis, or home valuation of any property. Copyright 2026 Doorify MLS, Inc. of North Carolina. All rights reserved.
Some IDX listings have been excluded from this IDX display. Brokers make an effort to deliver accurate information, but buyers should independently verify any information on which they will rely in a transaction. The listing broker shall not be responsible for any typographical errors, misinformation, or misprints, and they shall be held totally harmless from any damages arising from reliance upon this data. This data is provided exclusively for consumers’ personal, non-commercial use. Listings marked with an icon are provided courtesy of the Doorify MLS, Inc. of North Carolina, Internet Data Exchange Database. Closed (sold) listings may have been listed and/or sold by a real estate firm other than the firm(s) featured on this website. Closed data is not available until the sale of the property is recorded in the MLS. Home sale data is not an appraisal, CMA, competitive or comparative market analysis, or home valuation of any property. Copyright 2026 Doorify MLS, Inc. of North Carolina. All rights reserved.
Ask me questions while you tour the home.