1624 Swanson Rd Hughson, CA 95326
Estimated Value: $433,000 - $1,723,000
4
Beds
2
Baths
2,616
Sq Ft
$452/Sq Ft
Est. Value
About This Home
This home is located at 1624 Swanson Rd, Hughson, CA 95326 and is currently estimated at $1,182,108, approximately $451 per square foot. 1624 Swanson Rd is a home located in Stanislaus County with nearby schools including Hickman Elementary School and Hickman Middle School.
Ownership History
Date
Name
Owned For
Owner Type
Purchase Details
Closed on
Aug 17, 2017
Sold by
Chiesa Jill R and Chiesa Jill
Bought by
Chiesa Vito M
Current Estimated Value
Purchase Details
Closed on
Jun 20, 1994
Sold by
Fulford Joseph E
Bought by
Chiesa Vito M and Chiesa Jill R
Home Financials for this Owner
Home Financials are based on the most recent Mortgage that was taken out on this home.
Original Mortgage
$313,000
Interest Rate
8.57%
Create a Home Valuation Report for This Property
The Home Valuation Report is an in-depth analysis detailing your home's value as well as a comparison with similar homes in the area
Home Values in the Area
Average Home Value in this Area
Purchase History
| Date | Buyer | Sale Price | Title Company |
|---|---|---|---|
| Chiesa Vito M | -- | First American Title Company | |
| Chiesa Vito M | $355,000 | -- |
Source: Public Records
Mortgage History
| Date | Status | Borrower | Loan Amount |
|---|---|---|---|
| Closed | Chiesa Vito M | $313,000 |
Source: Public Records
Tax History Compared to Growth
Tax History
| Year | Tax Paid | Tax Assessment Tax Assessment Total Assessment is a certain percentage of the fair market value that is determined by local assessors to be the total taxable value of land and additions on the property. | Land | Improvement |
|---|---|---|---|---|
| 2025 | $5,535 | $520,873 | $313,553 | $207,320 |
| 2024 | $5,810 | $531,585 | $332,611 | $198,974 |
| 2023 | $5,593 | $516,018 | $259,116 | $256,902 |
| 2022 | $5,500 | $505,904 | $254,036 | $251,868 |
| 2021 | $5,394 | $495,985 | $249,055 | $246,930 |
| 2020 | $5,317 | $490,901 | $246,502 | $244,399 |
| 2019 | $5,226 | $478,825 | $241,669 | $237,156 |
| 2018 | $5,089 | $469,438 | $236,931 | $232,507 |
| 2017 | $5,122 | $444,687 | $232,286 | $212,401 |
| 2016 | $4,917 | $435,969 | $227,732 | $208,237 |
| 2015 | $4,705 | $417,295 | $188,762 | $228,533 |
| 2014 | $4,397 | $383,111 | $181,953 | $201,158 |
Source: Public Records
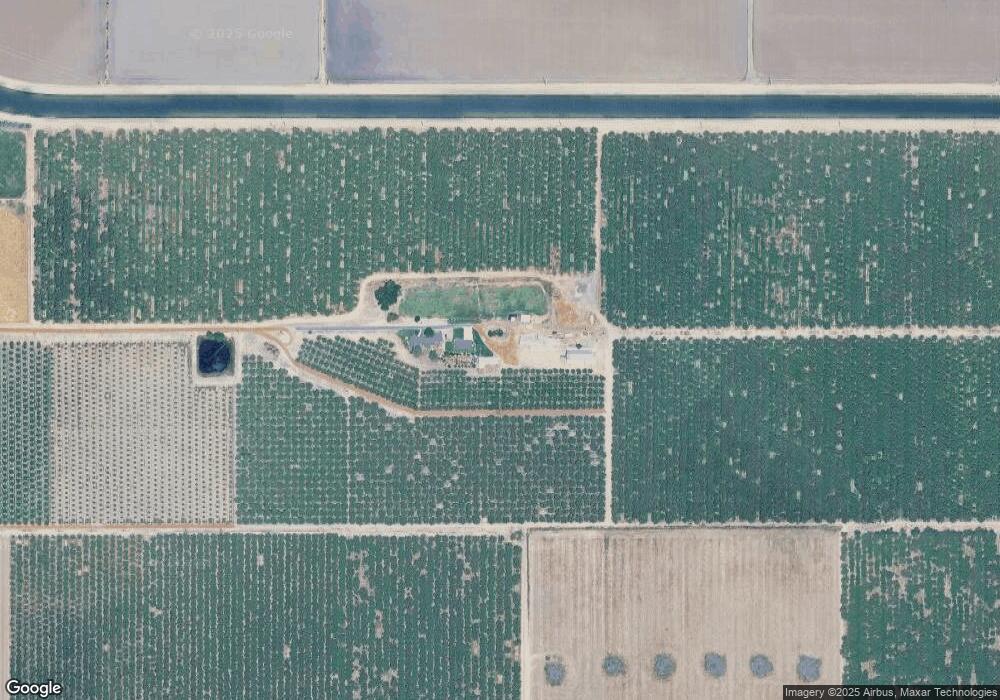
Map
Nearby Homes