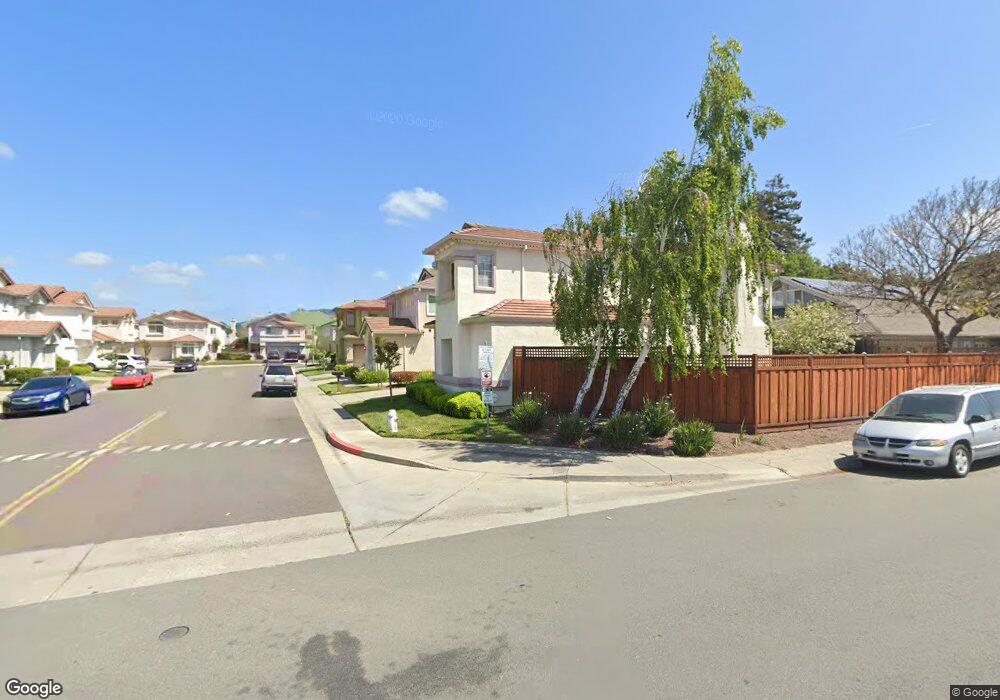
16240 Silverleaf Dr San Lorenzo, CA 94580
Estimated Value: $824,000 - $934,000
3
Beds
3
Baths
1,948
Sq Ft
$456/Sq Ft
Est. Value
About This Home
This home is located at 16240 Silverleaf Dr, San Lorenzo, CA 94580 and is currently estimated at $887,718, approximately $455 per square foot. 16240 Silverleaf Dr is a home located in Alameda County with nearby schools including Hesperian Elementary School, Edendale Middle, and San Lorenzo High School.
Ownership History
Date
Name
Owned For
Owner Type
Purchase Details
Closed on
Nov 16, 2018
Sold by
Houska Teresa Marie
Bought by
Houska Teresa Marie
Current Estimated Value
Home Financials for this Owner
Home Financials are based on the most recent Mortgage that was taken out on this home.
Original Mortgage
$165,000
Outstanding Balance
$145,084
Interest Rate
4.8%
Mortgage Type
New Conventional
Estimated Equity
$742,634
Purchase Details
Closed on
Feb 24, 2003
Sold by
Dronkers Anthony J
Bought by
Houska Teresa Marie
Home Financials for this Owner
Home Financials are based on the most recent Mortgage that was taken out on this home.
Original Mortgage
$250,000
Interest Rate
4.5%
Purchase Details
Closed on
Nov 10, 1993
Sold by
Santa Clara Land Title Company
Bought by
Dronkers Anthony J and Houska Teresa Marie
Home Financials for this Owner
Home Financials are based on the most recent Mortgage that was taken out on this home.
Original Mortgage
$199,150
Interest Rate
6.91%
Create a Home Valuation Report for This Property
The Home Valuation Report is an in-depth analysis detailing your home's value as well as a comparison with similar homes in the area
Home Values in the Area
Average Home Value in this Area
Purchase History
| Date | Buyer | Sale Price | Title Company |
|---|---|---|---|
| Houska Teresa Marie | -- | Bnt Title Company Of Califor | |
| Houska Teresa Marie | -- | Placer Title Company | |
| Dronkers Anthony J | $249,000 | Premier Title Company |
Source: Public Records
Mortgage History
| Date | Status | Borrower | Loan Amount |
|---|---|---|---|
| Open | Houska Teresa Marie | $165,000 | |
| Closed | Houska Teresa Marie | $250,000 | |
| Closed | Dronkers Anthony J | $199,150 |
Source: Public Records
Tax History
| Year | Tax Paid | Tax Assessment Tax Assessment Total Assessment is a certain percentage of the fair market value that is determined by local assessors to be the total taxable value of land and additions on the property. | Land | Improvement |
|---|---|---|---|---|
| 2025 | $5,637 | $416,030 | $127,470 | $295,560 |
| 2024 | $5,637 | $407,737 | $124,971 | $289,766 |
| 2023 | $5,614 | $406,604 | $122,520 | $284,084 |
| 2022 | $5,525 | $391,632 | $120,118 | $278,514 |
| 2021 | $5,370 | $383,817 | $117,763 | $273,054 |
| 2020 | $5,251 | $386,810 | $116,556 | $270,254 |
| 2019 | $5,252 | $379,225 | $114,270 | $264,955 |
| 2018 | $4,945 | $371,791 | $112,030 | $259,761 |
| 2017 | $4,720 | $364,503 | $109,834 | $254,669 |
| 2016 | $4,501 | $357,357 | $107,681 | $249,676 |
| 2015 | $4,402 | $351,991 | $106,064 | $245,927 |
| 2014 | $4,336 | $345,096 | $103,986 | $241,110 |
Source: Public Records
Map
Nearby Homes
- 15916 Bayberry Ln
- 1299 159th Ave
- 16366 Emery Ct
- 16188 Yale Ave
- 16006 E 14th St Unit 218
- 16006 E 14th St Unit 101
- 16006 E 14th St Unit 213
- 920 Elgin St Unit G
- 571 Pomona St
- 1550 162nd Ave Unit 47
- 16311 Ria Dr
- 1657 162nd Ave
- 1672 162nd Ave
- 1510 165th Ave
- 181 E Lewelling Blvd
- 1560 165th Ave
- 232 Loma Verde Dr
- 15540 Hesperian Blvd
- 15950 E 14th St
- 16449 Liberty St
- 16234 Silverleaf Dr
- 16246 Silverleaf Dr
- 16228 Silverleaf Dr
- 16100 Bertero Ave
- 16222 Silverleaf Dr
- 16247 Silverleaf Dr
- 16241 Silverleaf Dr
- 16253 Silverleaf Dr
- 16216 Silverleaf Dr
- 16235 Silverleaf Dr
- 16210 Silverleaf Dr
- 16229 Silverleaf Dr
- 16063 Bertero Ave
- 16047 Bertero Ave
- 15998 Bertero Ave
- 16031 Bertero Ave
- 16079 Bertero Ave
- 16205 Silverleaf Dr
- 16204 Silverleaf Dr
- 16199 Silverleaf Dr
Your Personal Tour Guide
Ask me questions while you tour the home.