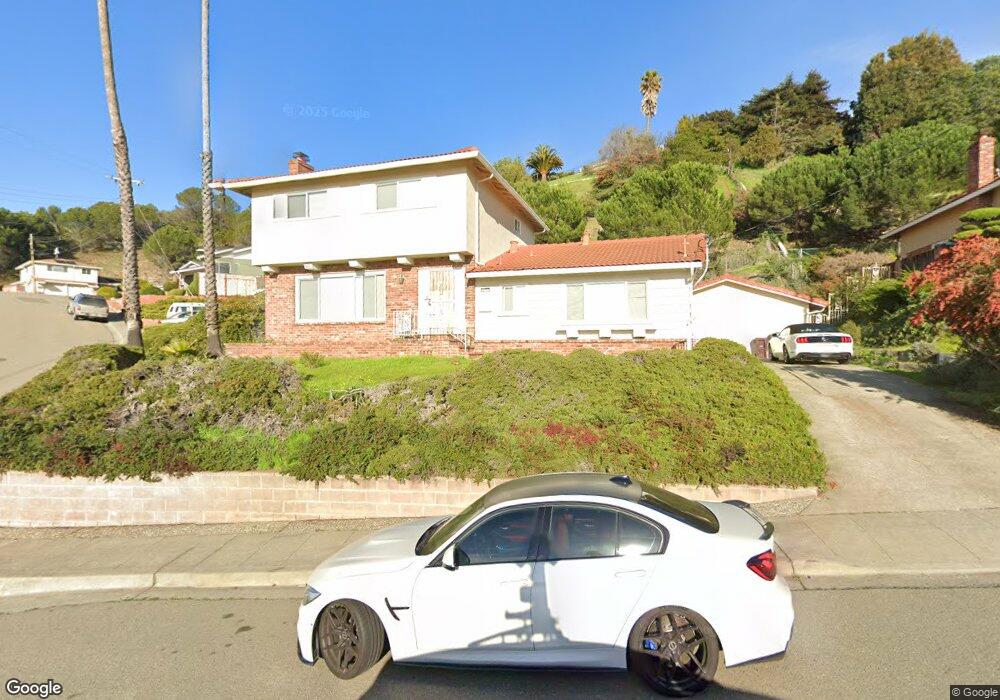
16242 San Remo Dr San Leandro, CA 94578
West Castro Valley NeighborhoodEstimated Value: $1,054,000 - $1,143,511
4
Beds
3
Baths
1,992
Sq Ft
$559/Sq Ft
Est. Value
About This Home
This home is located at 16242 San Remo Dr, San Leandro, CA 94578 and is currently estimated at $1,113,628, approximately $559 per square foot. 16242 San Remo Dr is a home located in Alameda County with nearby schools including Corvallis Elementary School, Edendale Middle, and San Lorenzo High School.
Ownership History
Date
Name
Owned For
Owner Type
Purchase Details
Closed on
Jul 12, 2016
Sold by
Xie Xiao Shan
Bought by
Xie Jian Min
Current Estimated Value
Purchase Details
Closed on
Sep 30, 2014
Sold by
Korematsu Haigh Karen Anne and Korematsu Kenneth Toyo
Bought by
Xie Xiao Shan and Xie Jian Min
Home Financials for this Owner
Home Financials are based on the most recent Mortgage that was taken out on this home.
Original Mortgage
$367,250
Outstanding Balance
$294,088
Interest Rate
5.37%
Mortgage Type
Adjustable Rate Mortgage/ARM
Estimated Equity
$819,540
Purchase Details
Closed on
Sep 9, 2011
Sold by
Korematsu Kathryn P
Bought by
Haigh Karen Anne Korematsu and Korematsu Kenneth Toyo
Purchase Details
Closed on
Sep 23, 2002
Sold by
Korematsu Fred T and Korematsu Kathryn P
Bought by
Revoca Fred T and Revoca Kathryn P Korematsu 2002
Create a Home Valuation Report for This Property
The Home Valuation Report is an in-depth analysis detailing your home's value as well as a comparison with similar homes in the area
Home Values in the Area
Average Home Value in this Area
Purchase History
| Date | Buyer | Sale Price | Title Company |
|---|---|---|---|
| Xie Jian Min | -- | Chicago Title Company | |
| Xie Xiao Shan | $565,000 | First American Title Company | |
| Korematsu Kenneth Toyo | -- | First American Title Company | |
| Korematsu Haigh Karen Anne | -- | First American Title Company | |
| Haigh Karen Anne Korematsu | -- | None Available | |
| Korematsu Kathryn P | -- | None Available | |
| Revoca Fred T | -- | -- |
Source: Public Records
Mortgage History
| Date | Status | Borrower | Loan Amount |
|---|---|---|---|
| Open | Xie Xiao Shan | $367,250 |
Source: Public Records
Tax History Compared to Growth
Tax History
| Year | Tax Paid | Tax Assessment Tax Assessment Total Assessment is a certain percentage of the fair market value that is determined by local assessors to be the total taxable value of land and additions on the property. | Land | Improvement |
|---|---|---|---|---|
| 2025 | $9,305 | $731,199 | $230,124 | $501,075 |
| 2024 | $9,305 | $716,865 | $225,613 | $491,252 |
| 2023 | $9,252 | $702,811 | $221,190 | $481,621 |
| 2022 | $9,315 | $689,031 | $216,853 | $472,178 |
| 2021 | $8,881 | $675,523 | $212,602 | $462,921 |
| 2020 | $8,698 | $668,599 | $210,423 | $458,176 |
| 2019 | $8,720 | $655,494 | $206,298 | $449,196 |
| 2018 | $8,274 | $642,643 | $202,254 | $440,389 |
| 2017 | $7,895 | $630,042 | $198,288 | $431,754 |
| 2016 | $7,035 | $573,616 | $187,821 | $385,795 |
| 2015 | $6,884 | $565,000 | $185,000 | $380,000 |
| 2014 | $1,638 | $107,204 | $39,001 | $68,203 |
Source: Public Records
Map
Nearby Homes
- 16274 San Remo Dr
- 2317 Prosperity Way
- 2250 Strang Ave
- 0 Lindview Dr
- 2081 Strang Ave
- 16085 Gramercy Dr
- 16265 Lyle St
- 16411 Saratoga St Unit 106W
- 2500 Miramar Ave Unit 203
- 2500 Miramar Ave Unit 101
- 16068 Gramercy Dr
- 16153 Windsor Dr
- 0 Miramonte Ave Unit 41107168
- 0 Miramonte Corner Saratoga Unit 41091854
- 2505 Miramar Ave Unit 122
- 16049 Selborne Dr
- 19100 Crest Ave Unit 30
- 19100 Crest Ave Unit 23
- 19100 Crest Ave Unit 100
- 16504 Page St
- 16250 San Remo Dr
- 2159 San Remo Ct
- 16258 San Remo Dr
- 16241 San Remo Dr
- 2167 San Remo Ct
- 16249 San Remo Dr
- 2158 San Remo Ct
- 16233 San Remo Dr
- 16257 San Remo Dr
- 2175 San Remo Ct
- 16266 San Remo Dr
- 16265 San Remo Dr Unit 702
- 16265 San Remo Dr
- 16223 San Remo Dr
- 2166 San Remo Ct
- 2347 Prosperity Way
- 16226 San Remo Dr
- 2351 Prosperity Way
- 2333 Prosperity Way
- 16240 Saratoga St