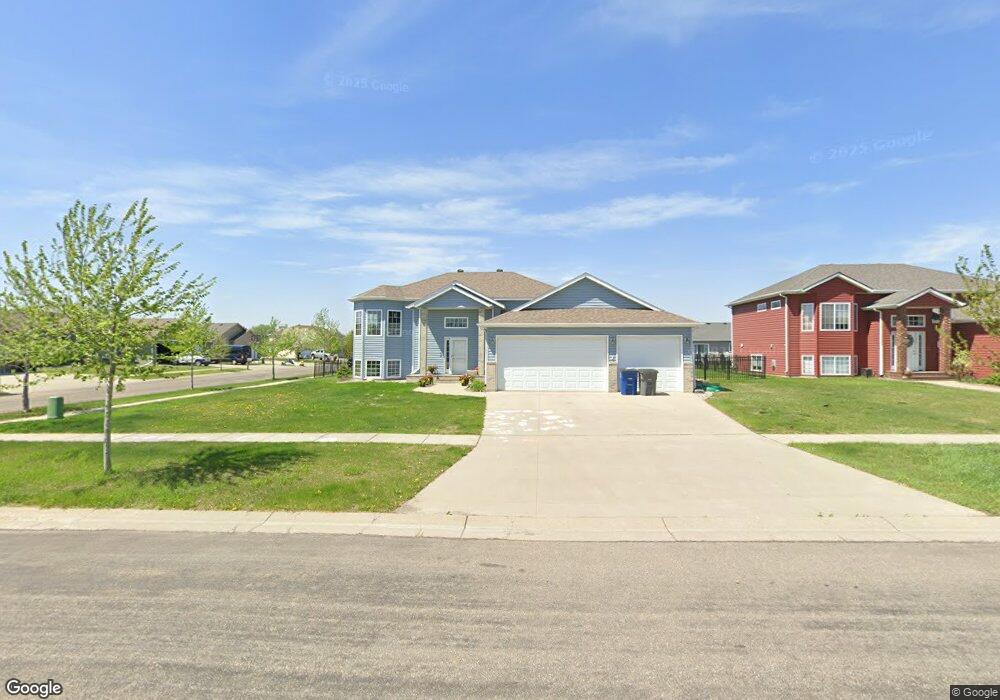
1625 36th St S Moorhead, MN 56560
Estimated Value: $378,000 - $443,000
4
Beds
3
Baths
2,356
Sq Ft
$168/Sq Ft
Est. Value
About This Home
This home is located at 1625 36th St S, Moorhead, MN 56560 and is currently estimated at $396,526, approximately $168 per square foot. 1625 36th St S is a home located in Clay County with nearby schools including Dorothy Dodds Elementary School, Horizon Middle School, and Moorhead High School.
Ownership History
Date
Name
Owned For
Owner Type
Purchase Details
Closed on
Oct 28, 2010
Sold by
Herlickson Corey T and Herlickson Stacey
Bought by
Averett James C and Averett Kari M
Current Estimated Value
Home Financials for this Owner
Home Financials are based on the most recent Mortgage that was taken out on this home.
Original Mortgage
$160,000
Outstanding Balance
$106,049
Interest Rate
4.36%
Mortgage Type
New Conventional
Estimated Equity
$290,477
Purchase Details
Closed on
Nov 3, 2006
Sold by
Rhr Construction Inc
Bought by
Herlickson Corey T
Home Financials for this Owner
Home Financials are based on the most recent Mortgage that was taken out on this home.
Original Mortgage
$150,784
Interest Rate
6.38%
Mortgage Type
New Conventional
Purchase Details
Closed on
Jun 20, 2006
Sold by
Proffutt Lp
Bought by
Rhr Construction Inc
Create a Home Valuation Report for This Property
The Home Valuation Report is an in-depth analysis detailing your home's value as well as a comparison with similar homes in the area
Home Values in the Area
Average Home Value in this Area
Purchase History
| Date | Buyer | Sale Price | Title Company |
|---|---|---|---|
| Averett James C | $200,000 | The Title Company Of Fargo | |
| Herlickson Corey T | $188,466 | None Available | |
| Rhr Construction Inc | $17,009 | None Available |
Source: Public Records
Mortgage History
| Date | Status | Borrower | Loan Amount |
|---|---|---|---|
| Open | Averett James C | $160,000 | |
| Previous Owner | Herlickson Corey T | $150,784 |
Source: Public Records
Tax History Compared to Growth
Tax History
| Year | Tax Paid | Tax Assessment Tax Assessment Total Assessment is a certain percentage of the fair market value that is determined by local assessors to be the total taxable value of land and additions on the property. | Land | Improvement |
|---|---|---|---|---|
| 2025 | $4,696 | $342,700 | $58,700 | $284,000 |
| 2024 | $4,696 | $324,500 | $58,700 | $265,800 |
| 2023 | $4,520 | $312,300 | $58,700 | $253,600 |
| 2022 | $4,030 | $295,600 | $54,200 | $241,400 |
| 2021 | $4,050 | $267,200 | $49,600 | $217,600 |
| 2020 | $3,978 | $266,400 | $49,600 | $216,800 |
| 2019 | $3,520 | $268,900 | $49,600 | $219,300 |
| 2018 | $3,502 | $255,400 | $49,600 | $205,800 |
| 2017 | $3,222 | $255,400 | $49,600 | $205,800 |
| 2016 | $3,038 | $244,500 | $49,600 | $194,900 |
| 2015 | $2,641 | $214,700 | $49,100 | $165,600 |
| 2014 | $4,824 | $214,700 | $49,100 | $165,600 |
Source: Public Records
Map
Nearby Homes
- 1617 36th St S
- 1632 35th Street Cir S
- 1620 35th Street Cir S
- 1609 36th St S
- 1733 35th Street Cir S
- 1608 35th Street Cir S
- 1608 35th Street Cir S Unit 56560
- 1725 35th Street Cir S
- 1624 36th St S
- 1702 36th St S
- 1519 36th St S
- 1616 36th St S
- 1717 35th Street Cir S
- 1710 36th St S
- 1530 35th Street Cir S
- 1511 36th St S
- 1718 36th St S
- 1518 35th Street Cir S
- 1516 36th St S
- 1709 35th Street Cir S