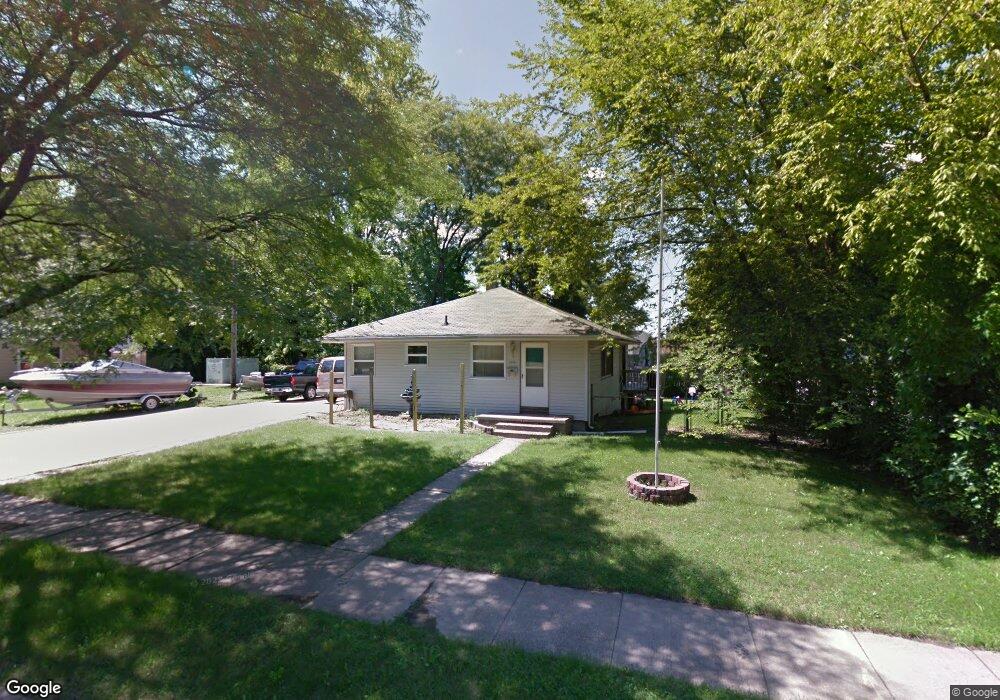
1625 Comfort St Lansing, MI 48915
Bassett Park NeighborhoodEstimated Value: $132,000 - $157,754
--
Bed
--
Bath
1,290
Sq Ft
$113/Sq Ft
Est. Value
About This Home
This home is located at 1625 Comfort St, Lansing, MI 48915 and is currently estimated at $146,189, approximately $113 per square foot. 1625 Comfort St is a home located in Ingham County with nearby schools including Willow School, Pattengill Academy, and J.W. Sexton High School.
Ownership History
Date
Name
Owned For
Owner Type
Purchase Details
Closed on
Jan 10, 2020
Sold by
Ward Robert
Bought by
Dansereau Mark
Current Estimated Value
Home Financials for this Owner
Home Financials are based on the most recent Mortgage that was taken out on this home.
Original Mortgage
$61,200
Outstanding Balance
$54,073
Interest Rate
3.6%
Mortgage Type
New Conventional
Estimated Equity
$92,116
Purchase Details
Closed on
Jan 8, 2020
Sold by
S Group Limited Partnership
Bought by
Ward Robert
Home Financials for this Owner
Home Financials are based on the most recent Mortgage that was taken out on this home.
Original Mortgage
$61,200
Outstanding Balance
$54,073
Interest Rate
3.6%
Mortgage Type
New Conventional
Estimated Equity
$92,116
Purchase Details
Closed on
Sep 26, 2002
Sold by
S Group
Bought by
Ward Robert
Purchase Details
Closed on
Mar 17, 1997
Sold by
Spalding John M-Dba S-Group
Bought by
Robinson Harold and Robinson Tina
Create a Home Valuation Report for This Property
The Home Valuation Report is an in-depth analysis detailing your home's value as well as a comparison with similar homes in the area
Home Values in the Area
Average Home Value in this Area
Purchase History
| Date | Buyer | Sale Price | Title Company |
|---|---|---|---|
| Dansereau Mark | $76,500 | None Available | |
| Ward Robert | $65,000 | None Available | |
| Ward Robert | $65,000 | -- | |
| Robinson Harold | $67,000 | -- |
Source: Public Records
Mortgage History
| Date | Status | Borrower | Loan Amount |
|---|---|---|---|
| Open | Dansereau Mark | $61,200 | |
| Closed | Ward Robert | $0 |
Source: Public Records
Tax History Compared to Growth
Tax History
| Year | Tax Paid | Tax Assessment Tax Assessment Total Assessment is a certain percentage of the fair market value that is determined by local assessors to be the total taxable value of land and additions on the property. | Land | Improvement |
|---|---|---|---|---|
| 2025 | $6,321 | $70,400 | $8,100 | $62,300 |
| 2024 | $42 | $63,700 | $8,100 | $55,600 |
| 2023 | $5,213 | $55,500 | $8,100 | $47,400 |
| 2022 | $3,966 | $49,600 | $7,900 | $41,700 |
| 2021 | $3,375 | $46,600 | $7,500 | $39,100 |
| 2020 | $2,498 | $43,600 | $7,500 | $36,100 |
| 2019 | $2,394 | $42,600 | $7,500 | $35,100 |
| 2018 | $2,244 | $38,600 | $7,500 | $31,100 |
| 2017 | $2,148 | $38,600 | $7,500 | $31,100 |
| 2016 | $2,054 | $37,900 | $7,500 | $30,400 |
| 2015 | $2,054 | $37,000 | $14,969 | $22,031 |
| 2014 | $2,054 | $36,400 | $17,000 | $19,400 |
Source: Public Records
Map
Nearby Homes
- 1620 Comfort St
- 1432 Redwood St
- 1422 Redwood St
- 1425 Muskegon Ave
- 1537 Roselawn Ave
- 1327 N Jenison Ave
- 1900 Kaplan St
- 1320 Glenrose Ave
- 1430 N Martin Luther King jr Blvd
- 1616 Roseneath Ave
- 1224 Theodore St
- 2241 Cumberland Rd
- 1840 W Maple St
- 1016 Cleo St
- 1310 W Maple St
- 1300 W Maple St
- 1129 N Martin Luther King jr Blvd
- 3021 N Grand River Ave
- 912 Cleo St
- 2316 Barstow Rd
- 1615 Comfort St
- 1705 Comfort St
- 1609 Comfort St
- 1626 Comfort St
- 1711 Comfort St
- 1614 Comfort St
- 1601 Comfort St
- 1708 Comfort St
- 1608 Comfort St
- 1715 Comfort St
- 1535 Comfort St
- 1526 Bassett St
- 1714 Comfort St
- 1519 Bassett St
- 1723 Comfort St
- 1519 Bassett Ave
- 1522 Bassett St
- 1520 Lamont St
- 1521 Comfort St Unit 1