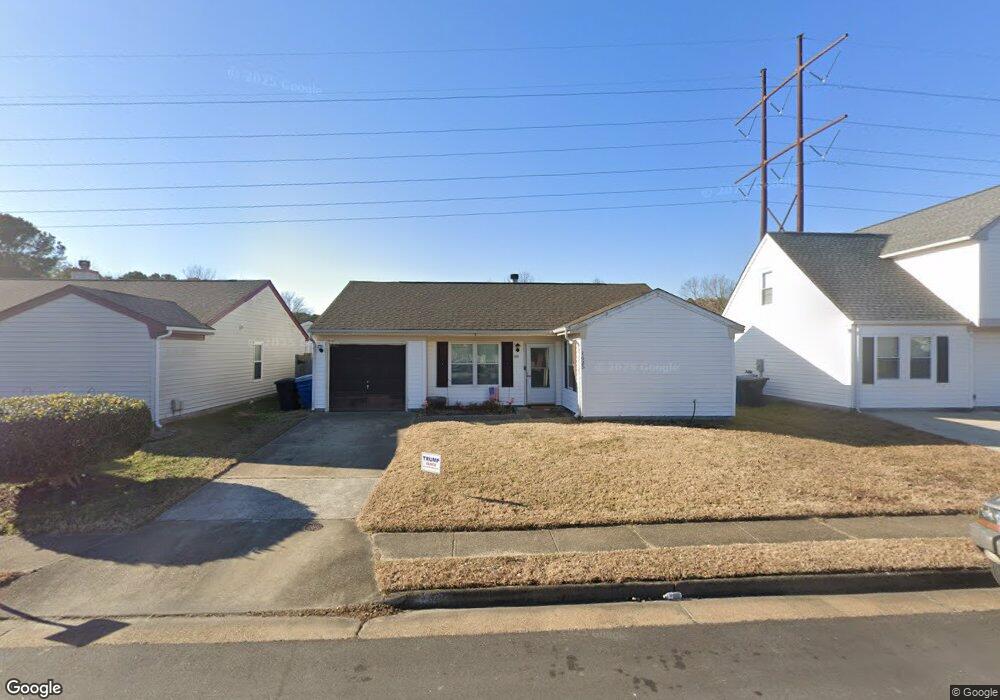
1625 Gallery Ave Virginia Beach, VA 23454
Dam Neck NeighborhoodEstimated Value: $338,000 - $382,000
3
Beds
2
Baths
1,131
Sq Ft
$311/Sq Ft
Est. Value
About This Home
This home is located at 1625 Gallery Ave, Virginia Beach, VA 23454 and is currently estimated at $352,227, approximately $311 per square foot. 1625 Gallery Ave is a home located in Virginia Beach City with nearby schools including Corporate Landing Elementary School, Corporate Landing Middle School, and Ocean Lakes High School.
Ownership History
Date
Name
Owned For
Owner Type
Purchase Details
Closed on
May 17, 2015
Sold by
Jason Feuerhahn Llc
Bought by
Best Marlon L
Current Estimated Value
Home Financials for this Owner
Home Financials are based on the most recent Mortgage that was taken out on this home.
Original Mortgage
$208,386
Outstanding Balance
$160,358
Interest Rate
3.65%
Mortgage Type
VA
Estimated Equity
$191,869
Purchase Details
Closed on
Nov 20, 2014
Sold by
Alg Trustee Llc and Estes Robert R
Bought by
Jason Feuerhahn Llc
Home Financials for this Owner
Home Financials are based on the most recent Mortgage that was taken out on this home.
Original Mortgage
$116,250
Interest Rate
3.93%
Mortgage Type
Construction
Purchase Details
Closed on
Jun 19, 2002
Sold by
Mangino Christian
Bought by
Estes Robert
Home Financials for this Owner
Home Financials are based on the most recent Mortgage that was taken out on this home.
Original Mortgage
$110,030
Interest Rate
6.81%
Mortgage Type
FHA
Create a Home Valuation Report for This Property
The Home Valuation Report is an in-depth analysis detailing your home's value as well as a comparison with similar homes in the area
Home Values in the Area
Average Home Value in this Area
Purchase History
| Date | Buyer | Sale Price | Title Company |
|---|---|---|---|
| Best Marlon L | $204,000 | -- | |
| Jason Feuerhahn Llc | $155,000 | -- | |
| Estes Robert | $111,000 | -- |
Source: Public Records
Mortgage History
| Date | Status | Borrower | Loan Amount |
|---|---|---|---|
| Open | Best Marlon L | $208,386 | |
| Previous Owner | Jason Feuerhahn Llc | $116,250 | |
| Previous Owner | Estes Robert | $110,030 |
Source: Public Records
Tax History Compared to Growth
Tax History
| Year | Tax Paid | Tax Assessment Tax Assessment Total Assessment is a certain percentage of the fair market value that is determined by local assessors to be the total taxable value of land and additions on the property. | Land | Improvement |
|---|---|---|---|---|
| 2025 | $2,716 | $295,500 | $135,000 | $160,500 |
| 2024 | $2,716 | $280,000 | $135,000 | $145,000 |
| 2023 | $2,673 | $270,000 | $125,000 | $145,000 |
| 2022 | $2,426 | $245,000 | $100,000 | $145,000 |
| 2021 | $2,189 | $221,100 | $88,000 | $133,100 |
| 2020 | $2,206 | $216,800 | $88,000 | $128,800 |
| 2019 | $2,117 | $199,000 | $80,000 | $119,000 |
| 2018 | $1,995 | $199,000 | $80,000 | $119,000 |
| 2017 | $1,887 | $188,200 | $80,000 | $108,200 |
| 2016 | $1,797 | $181,500 | $80,000 | $101,500 |
| 2015 | $1,866 | $188,500 | $87,000 | $101,500 |
| 2014 | -- | $183,600 | $87,000 | $96,600 |
Source: Public Records
Map
Nearby Homes
- 1637 Cassell St
- 1688 Gallery Ave
- 1156 Balch Place
- 1101 Gallery Ct
- 1612 Rollins Ct
- 1829 Mizzen Ln
- 1129 Snowbird Ln
- 1168 Gunn Hall Dr
- 1337 Mozart Dr
- 1414 Larkview Dr
- 1353 Mozart Dr
- 1940 General Booth Blvd
- 1253 Brahms Dr
- 1340 Crane Crescent
- 1085 Culmer Dr
- 1328 Crane Crescent
- 1148 Gauguin Dr
- 1649 Forest Fern Cir
- 1913 Ravel Dr
- 2009 Schubert Dr
- 1621 Gallery Ave
- 1629 Gallery Ave
- 1633 Gallery Ave
- 1617 Gallery Ave
- 1613 Gallery Ave
- 1637 Gallery Ave
- 1624 Gallery Ave
- 1628 Gallery Ave
- 1620 Gallery Ave
- 1616 Gallery Ave
- 1632 Gallery Ave
- 1609 Gallery Ave
- 1641 Gallery Ave
- 1612 Gallery Ave
- 1636 Gallery Ave
- 1605 Gallery Ave
- 1645 Gallery Ave
- 1608 Gallery Ave
- 1625 Cassell St
- 1621 Cassell St