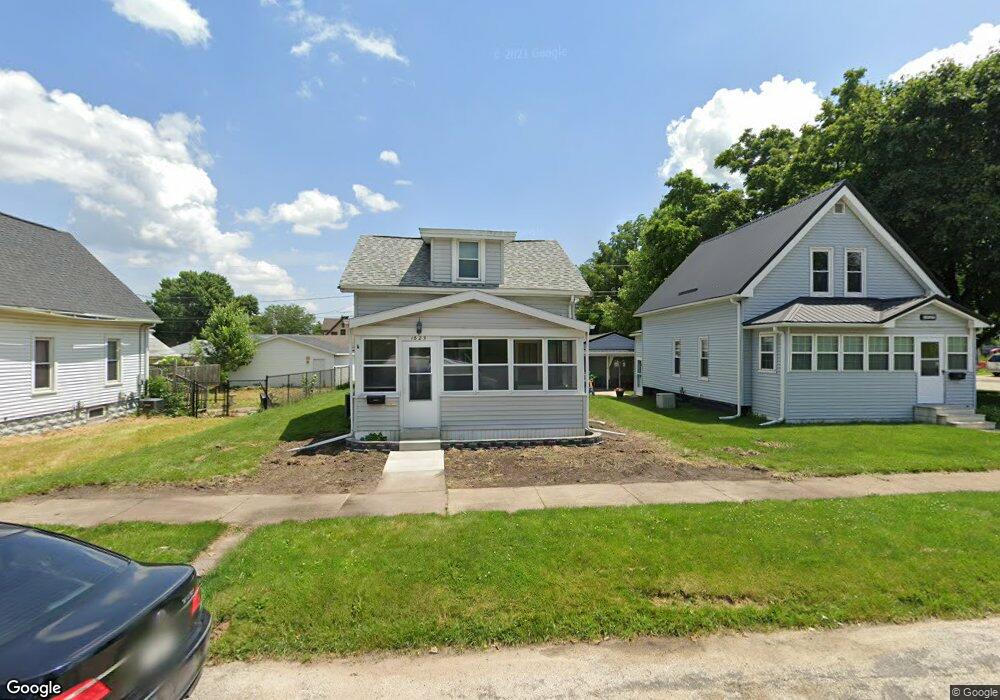
1625 N St SW Cedar Rapids, IA 52404
Southwest Area NeighborhoodEstimated Value: $103,000 - $150,000
2
Beds
1
Bath
936
Sq Ft
$134/Sq Ft
Est. Value
About This Home
This home is located at 1625 N St SW, Cedar Rapids, IA 52404 and is currently estimated at $125,634, approximately $134 per square foot. 1625 N St SW is a home located in Linn County with nearby schools including Junction City Elementary School, Grant Elementary School, and Bruce Hall Day Treatment Center.
Ownership History
Date
Name
Owned For
Owner Type
Purchase Details
Closed on
Apr 15, 2025
Sold by
Newcomb Dennis M and Newcomb Lynda L
Bought by
Newcomb Dennis M and Newcomb Lynda L
Current Estimated Value
Purchase Details
Closed on
Nov 15, 2012
Sold by
Wilkes Robert C and Herndon Wilkes Joyce
Bought by
Crawley Andrew S and Crawley Deann
Home Financials for this Owner
Home Financials are based on the most recent Mortgage that was taken out on this home.
Original Mortgage
$47,000
Interest Rate
3.37%
Mortgage Type
Future Advance Clause Open End Mortgage
Create a Home Valuation Report for This Property
The Home Valuation Report is an in-depth analysis detailing your home's value as well as a comparison with similar homes in the area
Home Values in the Area
Average Home Value in this Area
Purchase History
| Date | Buyer | Sale Price | Title Company |
|---|---|---|---|
| Newcomb Dennis M | -- | None Listed On Document | |
| Newcomb Dennis M | -- | None Listed On Document | |
| Crawley Andrew S | $42,500 | None Available |
Source: Public Records
Mortgage History
| Date | Status | Borrower | Loan Amount |
|---|---|---|---|
| Previous Owner | Crawley Andrew S | $47,000 |
Source: Public Records
Tax History Compared to Growth
Tax History
| Year | Tax Paid | Tax Assessment Tax Assessment Total Assessment is a certain percentage of the fair market value that is determined by local assessors to be the total taxable value of land and additions on the property. | Land | Improvement |
|---|---|---|---|---|
| 2025 | $1,494 | $106,500 | $26,500 | $80,000 |
| 2024 | $1,650 | $101,900 | $24,500 | $77,400 |
| 2023 | $1,650 | $101,900 | $24,500 | $77,400 |
| 2022 | $1,462 | $87,100 | $20,400 | $66,700 |
| 2021 | $1,418 | $79,500 | $20,400 | $59,100 |
| 2020 | $1,418 | $72,900 | $18,400 | $54,500 |
| 2019 | $1,344 | $70,900 | $18,400 | $52,500 |
| 2018 | $1,304 | $70,900 | $18,400 | $52,500 |
| 2017 | $1,633 | $68,200 | $18,400 | $49,800 |
| 2016 | $1,633 | $76,800 | $18,400 | $58,400 |
| 2015 | $1,675 | $78,733 | $18,360 | $60,373 |
| 2014 | $1,490 | $78,733 | $18,360 | $60,373 |
| 2013 | $1,454 | $78,733 | $18,360 | $60,373 |
Source: Public Records
Map
Nearby Homes