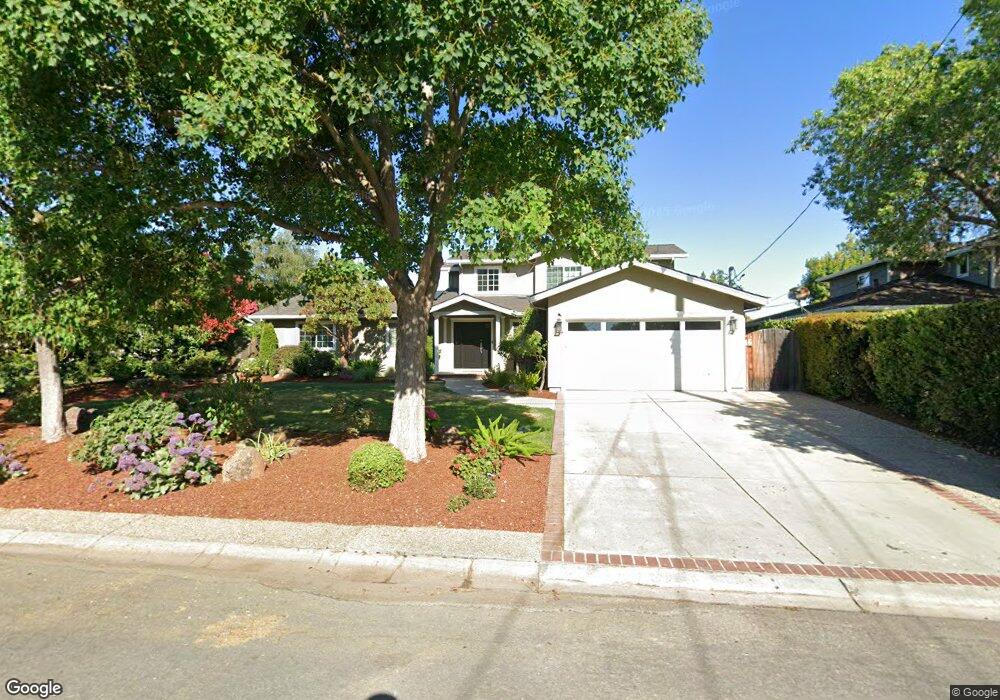
16251 Azalea Way Los Gatos, CA 95032
East Los Gatos NeighborhoodEstimated Value: $3,501,000 - $4,146,000
5
Beds
3
Baths
2,960
Sq Ft
$1,302/Sq Ft
Est. Value
About This Home
This home is located at 16251 Azalea Way, Los Gatos, CA 95032 and is currently estimated at $3,855,286, approximately $1,302 per square foot. 16251 Azalea Way is a home located in Santa Clara County with nearby schools including Blossom Hill Elementary School, Loma Prieta Elementary School, and Raymond J. Fisher Middle School.
Ownership History
Date
Name
Owned For
Owner Type
Purchase Details
Closed on
Sep 30, 2011
Sold by
Iarocci John J and Iarocci Kim D
Bought by
Iarocci John and Iarocci Kim D
Current Estimated Value
Purchase Details
Closed on
Apr 18, 2008
Sold by
Mader Thomas and Mader Wendy
Bought by
Iarocci John J and Iarocci Kim D
Purchase Details
Closed on
Aug 21, 2002
Sold by
Pearce Edwin B and Pearce Martha F
Bought by
Mader Thomas and Mader Wendy
Home Financials for this Owner
Home Financials are based on the most recent Mortgage that was taken out on this home.
Original Mortgage
$740,000
Interest Rate
5.5%
Mortgage Type
Purchase Money Mortgage
Create a Home Valuation Report for This Property
The Home Valuation Report is an in-depth analysis detailing your home's value as well as a comparison with similar homes in the area
Home Values in the Area
Average Home Value in this Area
Purchase History
| Date | Buyer | Sale Price | Title Company |
|---|---|---|---|
| Iarocci John | -- | None Available | |
| Iarocci John J | $1,990,000 | North American Title Co | |
| Mader Thomas | $990,000 | Old Republic Title Company |
Source: Public Records
Mortgage History
| Date | Status | Borrower | Loan Amount |
|---|---|---|---|
| Previous Owner | Mader Thomas | $740,000 |
Source: Public Records
Tax History Compared to Growth
Tax History
| Year | Tax Paid | Tax Assessment Tax Assessment Total Assessment is a certain percentage of the fair market value that is determined by local assessors to be the total taxable value of land and additions on the property. | Land | Improvement |
|---|---|---|---|---|
| 2025 | $30,218 | $2,613,891 | $1,510,541 | $1,103,350 |
| 2024 | $30,218 | $2,562,639 | $1,480,923 | $1,081,716 |
| 2023 | $29,701 | $2,512,392 | $1,451,886 | $1,060,506 |
| 2022 | $29,508 | $2,463,130 | $1,423,418 | $1,039,712 |
| 2021 | $29,041 | $2,414,834 | $1,395,508 | $1,019,326 |
| 2020 | $28,535 | $2,390,074 | $1,381,199 | $1,008,875 |
| 2019 | $28,154 | $2,343,211 | $1,354,117 | $989,094 |
| 2018 | $27,773 | $2,297,266 | $1,327,566 | $969,700 |
| 2017 | $27,718 | $2,252,223 | $1,301,536 | $950,687 |
| 2016 | $27,021 | $2,208,063 | $1,276,016 | $932,047 |
| 2015 | $26,870 | $2,174,897 | $1,256,850 | $918,047 |
| 2014 | $26,477 | $2,132,295 | $1,232,231 | $900,064 |
Source: Public Records
Map
Nearby Homes
- 141 Fairmead Ln
- 200 Westchester Dr
- 15021 Briggs Ct
- 22981 California 17
- 167 Las Astas Dr
- 170 Twin Oaks Dr
- 0 Twin Oaks Dr Unit ML81936703
- 15315 Santella Ct
- 2026 Lynn Ave
- 4787 Hatfield Walkway Unit 4
- 4768 Hatfield Walk Unit 2
- 16244 Kennedy Rd
- 16497 S Kennedy Rd
- 2303 Saidel Dr Unit 4
- 120 Pinta Ct
- 14685 Oka Rd Unit 28
- 420 Alberto Way Unit 5
- 14721 Shannon Rd
- 5222 Adalina Ct
- 4975 Bel Escou Dr
- 16241 Azalea Way
- 16261 Azalea Way
- 16330 Lavender Ln
- 16320 Lavender Ln
- 16271 Azalea Way
- 16231 Azalea Way
- 16340 Lavender Ln
- 16310 Lavender Ln
- 16254 Azalea Way
- 16242 Azalea Way
- 16266 Azalea Way
- 16300 Lavender Ln
- 16230 Azalea Way
- 16350 Lavender Ln
- 16281 Azalea Way
- 16280 Azalea Way
- 16191 Jacaranda Way
- 16201 Jacaranda Way
- 16181 Jacaranda Way
- 16341 Lavender Ln