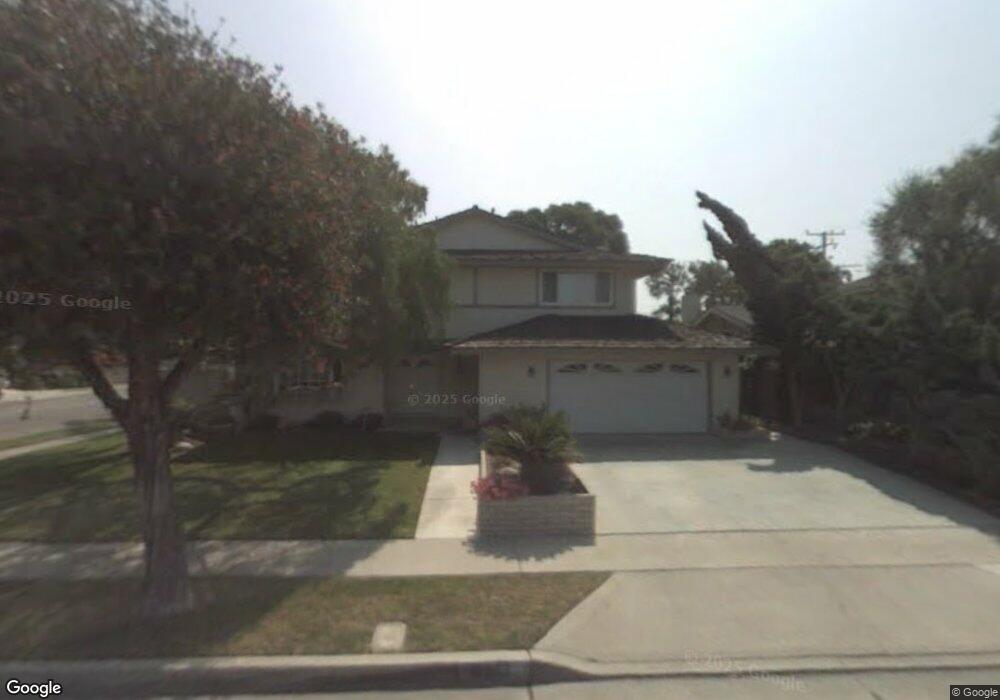
16252 Duchess Ln Huntington Beach, CA 92647
Estimated Value: $1,559,471 - $1,615,000
4
Beds
3
Baths
2,293
Sq Ft
$693/Sq Ft
Est. Value
About This Home
This home is located at 16252 Duchess Ln, Huntington Beach, CA 92647 and is currently estimated at $1,589,618, approximately $693 per square foot. 16252 Duchess Ln is a home located in Orange County with nearby schools including Circle View Elementary School, Spring View Middle School, and Marina High School.
Ownership History
Date
Name
Owned For
Owner Type
Purchase Details
Closed on
Mar 11, 2008
Sold by
Falagan Bernard A and Falagan Sandra J
Bought by
Mastroni Frank and Mastroni Angela
Current Estimated Value
Home Financials for this Owner
Home Financials are based on the most recent Mortgage that was taken out on this home.
Original Mortgage
$633,000
Outstanding Balance
$402,114
Interest Rate
6.11%
Mortgage Type
Purchase Money Mortgage
Estimated Equity
$1,187,504
Purchase Details
Closed on
Aug 3, 2006
Sold by
Falagan Bernard A and Falagan Sandra J
Bought by
Falagan Bernard A and Falagan Sandra J
Purchase Details
Closed on
Feb 21, 1996
Sold by
Sandon Lance M and Sandon Tamara Jean
Bought by
Falagan B Anatole and Falagan Sandra J
Home Financials for this Owner
Home Financials are based on the most recent Mortgage that was taken out on this home.
Original Mortgage
$265,000
Interest Rate
7.34%
Create a Home Valuation Report for This Property
The Home Valuation Report is an in-depth analysis detailing your home's value as well as a comparison with similar homes in the area
Home Values in the Area
Average Home Value in this Area
Purchase History
| Date | Buyer | Sale Price | Title Company |
|---|---|---|---|
| Mastroni Frank | $819,000 | First American Title Company | |
| Falagan Bernard A | -- | None Available | |
| Falagan B Anatole | $295,000 | Gateway Title |
Source: Public Records
Mortgage History
| Date | Status | Borrower | Loan Amount |
|---|---|---|---|
| Open | Mastroni Frank | $633,000 | |
| Previous Owner | Falagan B Anatole | $265,000 |
Source: Public Records
Tax History Compared to Growth
Tax History
| Year | Tax Paid | Tax Assessment Tax Assessment Total Assessment is a certain percentage of the fair market value that is determined by local assessors to be the total taxable value of land and additions on the property. | Land | Improvement |
|---|---|---|---|---|
| 2025 | $11,865 | $1,075,766 | $894,345 | $181,421 |
| 2024 | $11,865 | $1,054,673 | $876,809 | $177,864 |
| 2023 | $10,760 | $957,208 | $810,631 | $146,577 |
| 2022 | $10,605 | $938,440 | $794,737 | $143,703 |
| 2021 | $10,408 | $920,040 | $779,154 | $140,886 |
| 2020 | $10,395 | $920,040 | $779,154 | $140,886 |
| 2019 | $10,211 | $902,000 | $763,876 | $138,124 |
| 2018 | $9,646 | $854,000 | $715,876 | $138,124 |
| 2017 | $9,037 | $796,000 | $657,876 | $138,124 |
| 2016 | $8,828 | $796,000 | $657,876 | $138,124 |
| 2015 | $7,747 | $696,000 | $557,876 | $138,124 |
| 2014 | $7,741 | $696,000 | $557,876 | $138,124 |
Source: Public Records
Map
Nearby Homes
- 16261 Angler Ln
- 16401 Mercier Ln
- 6292 Heil Ave
- 6351 Gloria Dr
- 16652 Busby Ln
- 16542 Los Verdes Ln
- 5751 Mangrum Dr
- 6522 Limerick Dr
- 15801 Carrie Ln
- 6631 Walton Dr
- 5591 Heil Ave
- 6301 Warner Ave Unit 40
- 6301 Warner Ave Unit 88
- 6781 Retherford Dr
- 7223 Alchemy Cir
- 7252 Ellington Dr
- 7231 Alchemy Cir
- 7248 Aura Cir
- 7264 Aura Cir
- 7272 Ellington Dr
- 16262 Duchess Ln
- 16251 Woodstock Ln
- 16272 Duchess Ln
- 6181 Palisade Dr
- 6171 Palisade Dr
- 16271 Woodstock Ln
- 16251 Duchess Ln
- 16231 Woodstock Ln
- 16261 Duchess Ln
- 6161 Palisade Dr
- 16282 Duchess Ln
- 16271 Duchess Ln
- 16281 Woodstock Ln
- 6151 Palisade Dr
- 16221 Woodstock Ln
- 16281 Duchess Ln
- 16292 Duchess Ln
- 6182 Montecito Dr
- 6172 Montecito Dr
- 16252 Woodstock Ln