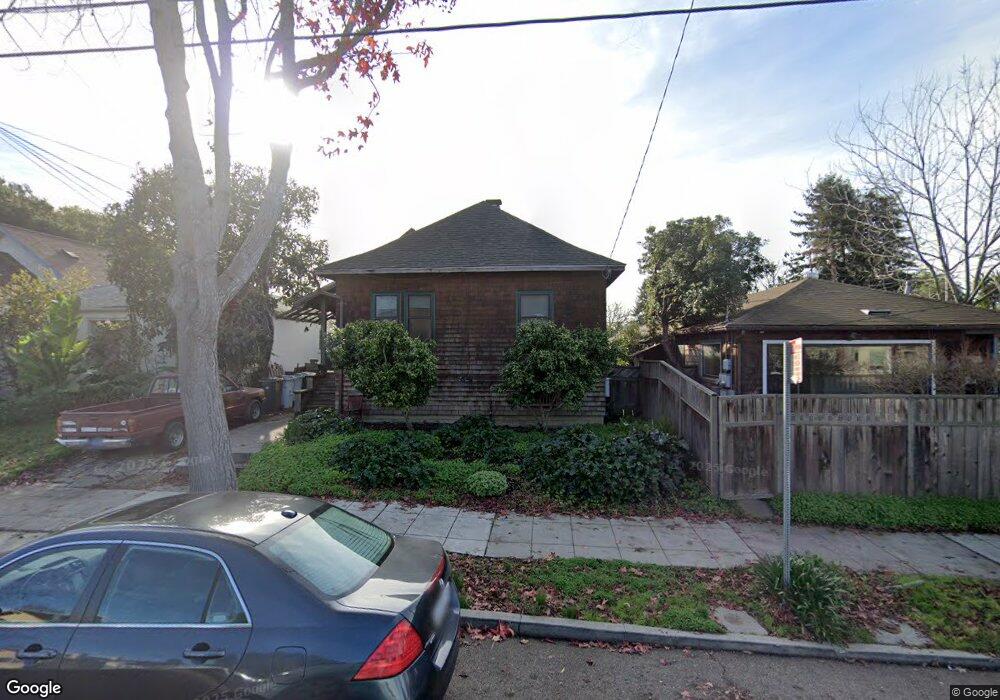
1626 Derby St Berkeley, CA 94703
South Berkeley NeighborhoodEstimated Value: $680,723 - $1,005,000
1
Bed
1
Bath
672
Sq Ft
$1,322/Sq Ft
Est. Value
About This Home
This home is located at 1626 Derby St, Berkeley, CA 94703 and is currently estimated at $888,181, approximately $1,321 per square foot. 1626 Derby St is a home located in Alameda County with nearby schools including Washington Elementary School, Malcolm X Elementary School, and Oxford Elementary School.
Ownership History
Date
Name
Owned For
Owner Type
Purchase Details
Closed on
Mar 16, 2017
Sold by
Malley Jean M O
Bought by
Malley Jean M O
Current Estimated Value
Home Financials for this Owner
Home Financials are based on the most recent Mortgage that was taken out on this home.
Original Mortgage
$208,500
Interest Rate
4.15%
Mortgage Type
New Conventional
Purchase Details
Closed on
Dec 29, 1997
Sold by
Malley Jean and Malley Jean M
Bought by
Omalley Jean M
Create a Home Valuation Report for This Property
The Home Valuation Report is an in-depth analysis detailing your home's value as well as a comparison with similar homes in the area
Home Values in the Area
Average Home Value in this Area
Purchase History
| Date | Buyer | Sale Price | Title Company |
|---|---|---|---|
| Malley Jean M O | -- | Old Republic Title Company | |
| Omalley Jean M | -- | -- |
Source: Public Records
Mortgage History
| Date | Status | Borrower | Loan Amount |
|---|---|---|---|
| Closed | Malley Jean M O | $208,500 |
Source: Public Records
Tax History
| Year | Tax Paid | Tax Assessment Tax Assessment Total Assessment is a certain percentage of the fair market value that is determined by local assessors to be the total taxable value of land and additions on the property. | Land | Improvement |
|---|---|---|---|---|
| 2025 | $4,242 | $120,170 | $60,935 | $66,235 |
| 2024 | $4,242 | $117,677 | $59,741 | $64,936 |
| 2023 | $4,081 | $122,232 | $58,569 | $63,663 |
| 2022 | $4,129 | $112,836 | $57,421 | $62,415 |
| 2021 | $4,109 | $110,486 | $56,295 | $61,191 |
| 2020 | $3,893 | $116,282 | $55,718 | $60,564 |
| 2019 | $3,718 | $114,002 | $54,626 | $59,376 |
| 2018 | $3,610 | $111,767 | $53,555 | $58,212 |
| 2017 | $3,451 | $109,576 | $52,505 | $57,071 |
| 2016 | $3,286 | $107,427 | $51,475 | $55,952 |
| 2015 | $3,218 | $105,814 | $50,702 | $55,112 |
| 2014 | $3,108 | $103,741 | $49,709 | $54,032 |
Source: Public Records
Map
Nearby Homes
- 1612 Parker St
- 1515 Derby St
- 1634 Blake St
- 2750 Sacramento St
- 1450 Ward St
- 2701 Grant St
- 2758 Sacramento St
- 1604 Dwight Way
- 2774 Sacramento St
- 2829 California St
- 2782 Sacramento St
- 2790 Sacramento St
- 1645 Dwight Way
- 1535 Julia St
- 1901 Parker St Unit 3
- 2926 Ellis St
- 2922 Stanton St
- 2717 Mabel St
- 1646 Ashby Ave
- 2350 Sacramento St
Your Personal Tour Guide
Ask me questions while you tour the home.