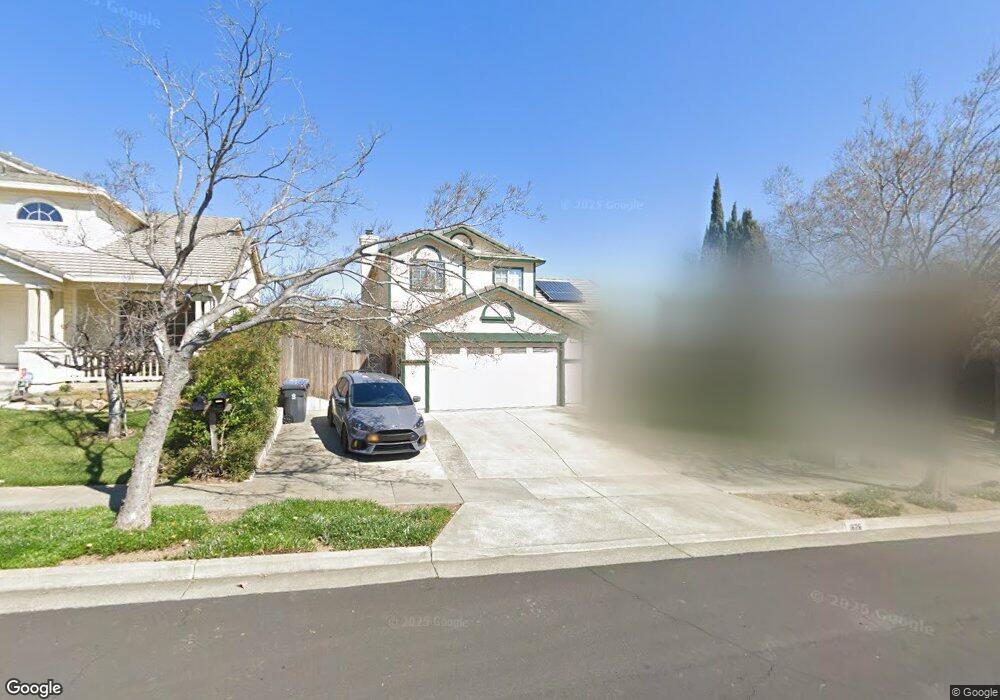
1626 Highland Cir Fairfield, CA 94534
Estimated Value: $626,432 - $683,000
4
Beds
3
Baths
1,718
Sq Ft
$377/Sq Ft
Est. Value
About This Home
This home is located at 1626 Highland Cir, Fairfield, CA 94534 and is currently estimated at $647,858, approximately $377 per square foot. 1626 Highland Cir is a home located in Solano County with nearby schools including Cordelia Hills Elementary School, Green Valley Middle School, and Angelo Rodriguez High School.
Ownership History
Date
Name
Owned For
Owner Type
Purchase Details
Closed on
Mar 4, 2009
Sold by
Deutsche Bank National Trust Company
Bought by
Hampton Joshua H and Hampton Bethany A
Current Estimated Value
Home Financials for this Owner
Home Financials are based on the most recent Mortgage that was taken out on this home.
Original Mortgage
$240,070
Outstanding Balance
$151,922
Interest Rate
5.04%
Mortgage Type
FHA
Estimated Equity
$495,936
Purchase Details
Closed on
Nov 18, 2008
Sold by
Chanthaphat Somdee and Douangpanya Chandy
Bought by
Deutsche Bank National Trust Company
Purchase Details
Closed on
Jul 22, 1994
Sold by
Albert D Seeno Construction Co
Bought by
Chanthaphat Somdee and Douangpanya Chandy
Home Financials for this Owner
Home Financials are based on the most recent Mortgage that was taken out on this home.
Original Mortgage
$132,900
Interest Rate
8.38%
Create a Home Valuation Report for This Property
The Home Valuation Report is an in-depth analysis detailing your home's value as well as a comparison with similar homes in the area
Home Values in the Area
Average Home Value in this Area
Purchase History
| Date | Buyer | Sale Price | Title Company |
|---|---|---|---|
| Hampton Joshua H | $244,500 | Chicago Title Insurance Co | |
| Deutsche Bank National Trust Company | $327,340 | None Available | |
| Chanthaphat Somdee | $166,500 | Frontier Title Company |
Source: Public Records
Mortgage History
| Date | Status | Borrower | Loan Amount |
|---|---|---|---|
| Open | Hampton Joshua H | $240,070 | |
| Previous Owner | Chanthaphat Somdee | $132,900 |
Source: Public Records
Tax History Compared to Growth
Tax History
| Year | Tax Paid | Tax Assessment Tax Assessment Total Assessment is a certain percentage of the fair market value that is determined by local assessors to be the total taxable value of land and additions on the property. | Land | Improvement |
|---|---|---|---|---|
| 2025 | $3,759 | $314,850 | $83,701 | $231,149 |
| 2024 | $3,759 | $308,677 | $82,060 | $226,617 |
| 2023 | $3,631 | $302,625 | $80,451 | $222,174 |
| 2022 | $3,586 | $296,692 | $78,874 | $217,818 |
| 2021 | $3,532 | $290,876 | $77,328 | $213,548 |
| 2020 | $3,653 | $287,895 | $76,536 | $211,359 |
| 2019 | $3,623 | $282,251 | $75,036 | $207,215 |
| 2018 | $3,725 | $276,717 | $73,565 | $203,152 |
| 2017 | $3,728 | $271,292 | $72,123 | $199,169 |
| 2016 | $3,702 | $265,973 | $70,709 | $195,264 |
| 2015 | $3,495 | $261,978 | $69,647 | $192,331 |
| 2014 | $3,469 | $256,847 | $68,283 | $188,564 |
Source: Public Records
Map
Nearby Homes
- 1756 Fawn Glen Cir
- 4732 Opus Cir
- 2197 Yellow Rose Cir
- 824 Crescendo St
- 840 Crescendo St
- 848 Crescendo St
- 1946 Leaning Oak Ct
- The Dulcian Plan at Cadence at Gold Hill
- The Adagio Plan at Cadence at Gold Hill
- The Cornet Plan at Cadence at Gold Hill
- The Entrata Plan at Cadence at Gold Hill
- The Bolero Plan at Cadence at Gold Hill
- 4927 Claremont Ct
- 4538 Paseo Dr
- 4881 Regency Place
- 828 Stoneridge Cir
- 5062 Brookdale Cir
- 5002 Greenwood Ct
- 680 Silver Lake Dr
- 4933 Brittany Dr
- 1630 Highland Cir
- 1622 Highland Cir
- 1618 Highland Cir
- 1634 Highland Cir
- 1608 Highland Ct
- 1614 Highland Cir
- 1638 Highland Cir
- 1607 Highland Ct
- 1642 Highland Cir
- 1612 Highland Ct
- 1610 Highland Cir
- 1611 Highland Ct
- 1601 Highland Cir
- 1616 Highland Ct
- 1606 Highland Cir
- 1646 Highland Cir
- 1663 Highland Cir
- 1615 Highland Ct
- 1605 Highland Cir
- 1667 Highland Cir