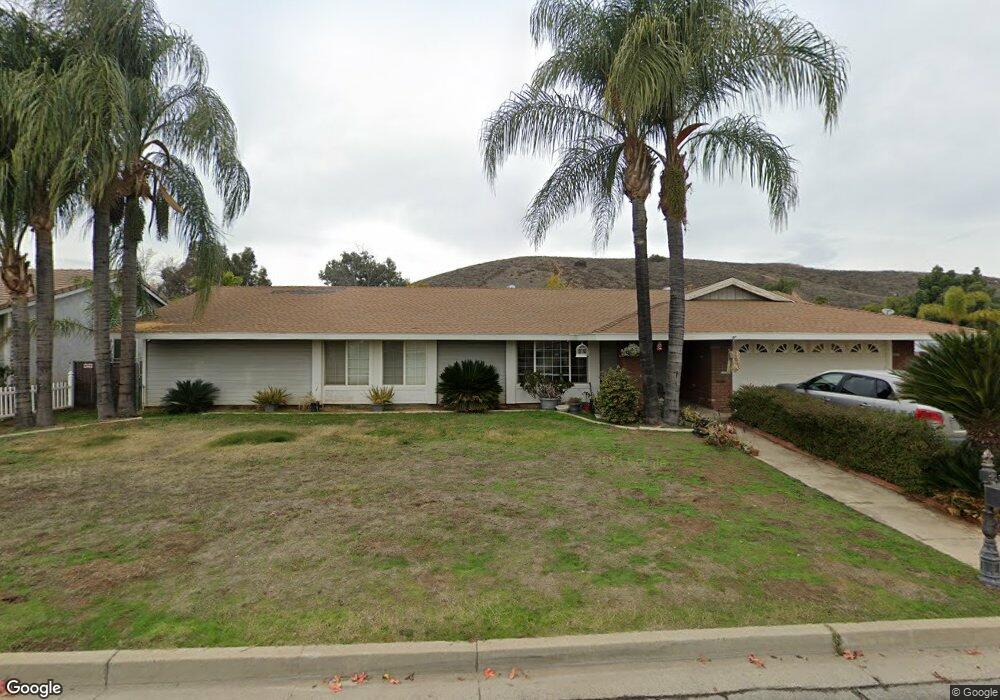
16263 Cimarron Rd Lake Elsinore, CA 92530
Country Club Heights NeighborhoodEstimated Value: $604,000 - $659,450
4
Beds
2
Baths
1,931
Sq Ft
$328/Sq Ft
Est. Value
About This Home
This home is located at 16263 Cimarron Rd, Lake Elsinore, CA 92530 and is currently estimated at $632,863, approximately $327 per square foot. 16263 Cimarron Rd is a home located in Riverside County with nearby schools including Machado Elementary School, Terra Cotta Middle School, and Lakeside High School.
Ownership History
Date
Name
Owned For
Owner Type
Purchase Details
Closed on
Jun 11, 2009
Sold by
Us Bank National Association
Bought by
Frazier Joshua and Frazier Betsy
Current Estimated Value
Home Financials for this Owner
Home Financials are based on the most recent Mortgage that was taken out on this home.
Original Mortgage
$189,504
Interest Rate
5.59%
Mortgage Type
FHA
Purchase Details
Closed on
Apr 18, 2008
Sold by
Smith James H and Smith Robin J
Bought by
U S Bank Na and Citigroup Mortgage Loan Trust 2007-Amc2
Purchase Details
Closed on
Nov 16, 1995
Sold by
Ford Consumer Finance Company Inc
Bought by
Smith James H and Smith Robin J
Home Financials for this Owner
Home Financials are based on the most recent Mortgage that was taken out on this home.
Original Mortgage
$117,300
Interest Rate
8.5%
Mortgage Type
Seller Take Back
Purchase Details
Closed on
Jun 28, 1995
Sold by
Diggs Larry and Diggs Lorraine
Bought by
Ford Consumer Finance Co Inc
Create a Home Valuation Report for This Property
The Home Valuation Report is an in-depth analysis detailing your home's value as well as a comparison with similar homes in the area
Home Values in the Area
Average Home Value in this Area
Purchase History
| Date | Buyer | Sale Price | Title Company |
|---|---|---|---|
| Frazier Joshua | $193,000 | Stewart Title Of California | |
| U S Bank Na | $315,000 | Lsi Title Company Ca | |
| Smith James H | $120,000 | Fidelity Title | |
| Ford Consumer Finance Co Inc | -- | American Title Ins Co |
Source: Public Records
Mortgage History
| Date | Status | Borrower | Loan Amount |
|---|---|---|---|
| Previous Owner | Frazier Joshua | $189,504 | |
| Previous Owner | Smith James H | $117,300 |
Source: Public Records
Tax History Compared to Growth
Tax History
| Year | Tax Paid | Tax Assessment Tax Assessment Total Assessment is a certain percentage of the fair market value that is determined by local assessors to be the total taxable value of land and additions on the property. | Land | Improvement |
|---|---|---|---|---|
| 2025 | $2,519 | $249,110 | $38,713 | $210,397 |
| 2023 | $2,519 | $239,438 | $37,210 | $202,228 |
| 2022 | $2,437 | $234,744 | $36,481 | $198,263 |
| 2021 | $2,388 | $230,142 | $35,766 | $194,376 |
| 2020 | $2,364 | $227,783 | $35,400 | $192,383 |
| 2019 | $2,318 | $223,317 | $34,706 | $188,611 |
| 2018 | $2,272 | $218,939 | $34,027 | $184,912 |
| 2017 | $2,228 | $214,647 | $33,360 | $181,287 |
| 2016 | $2,146 | $210,439 | $32,706 | $177,733 |
| 2015 | $2,120 | $207,280 | $32,216 | $175,064 |
| 2014 | $2,049 | $203,222 | $31,586 | $171,636 |
Source: Public Records
Map
Nearby Homes
- 16376 Bailey St
- 16427 Bailey St
- 1 Bailey St
- 15 Bailey St
- 16377 Lakeshore Dr Unit 4F
- 16377 Lakeshore Dr Unit 2C
- 16377 Lakeshore Dr Unit 2F
- 0 E Stevens Unit DW25123440
- 0 E Stevens Unit SW25088148
- 0 E Stevens Unit DW25037646
- 7 Stevens St
- 0 Swan Ave Unit OC25229033
- 0 Stevens #101-2
- 16395 Broadway St
- 4678 Swan Ave
- 842 Porta Marina Ln
- 4671 Swan Ave
- 848 Porta Marina Ln
- 4665 Swan Ave
- Plan 1539 Modeled at Villa Real at Terracina
- 16293 Cimarron Rd
- 16189 Cimarron Rd
- 16292 Cimarron Rd
- 16307 Cimarron Rd
- 16306 Cimarron Rd
- 16278 Cimarron Rd
- 16175 Cimarron Rd
- 16262 Cimarron Rd
- 16200 Cimarron Rd
- 16321 Cimarron Rd
- 30500 Dryden St
- 16248 Cimarron Rd
- 16188 Cimarron Rd
- 16212 Cimarron Rd
- 30650 Dryden St
- 16124 Cimarron Rd
- 30300 Dryden St
- 16320 Cimarron Rd
- 16174 Cimarron Rd
- 30800 Dryden St