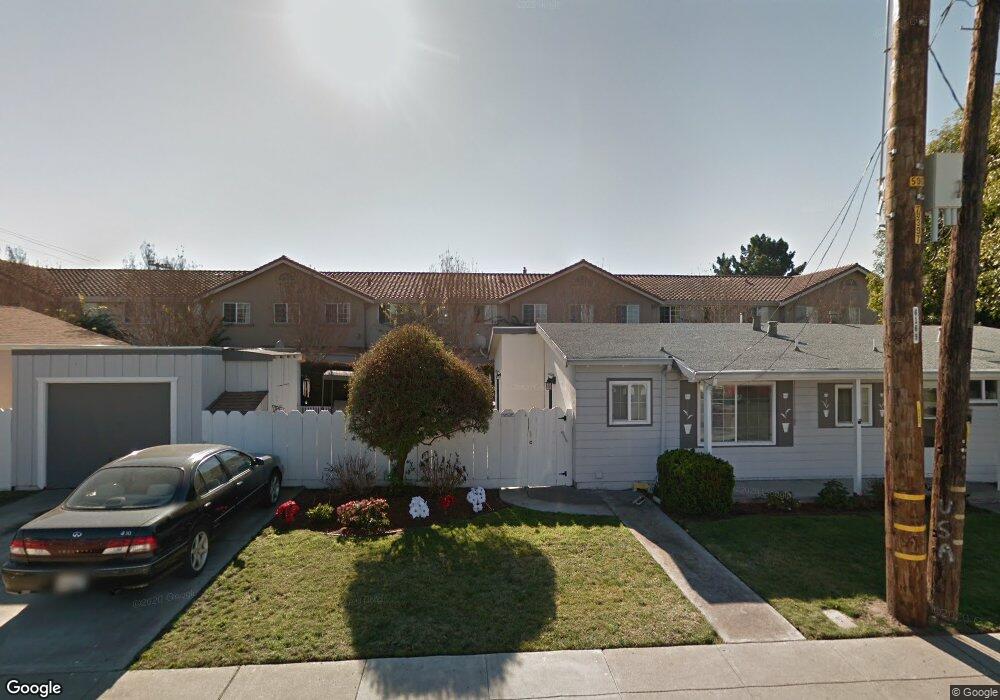
16267 Ashland Ave Unit 3 San Lorenzo, CA 94580
Estimated Value: $523,000 - $588,000
3
Beds
2
Baths
1,256
Sq Ft
$447/Sq Ft
Est. Value
About This Home
This home is located at 16267 Ashland Ave Unit 3, San Lorenzo, CA 94580 and is currently estimated at $561,818, approximately $447 per square foot. 16267 Ashland Ave Unit 3 is a home located in Alameda County with nearby schools including Hesperian Elementary School, Edendale Middle, and San Lorenzo High School.
Ownership History
Date
Name
Owned For
Owner Type
Purchase Details
Closed on
Nov 26, 2014
Sold by
Zamora Marvin
Bought by
Zamora Marvin and Zamora Efren M
Current Estimated Value
Purchase Details
Closed on
May 2, 2014
Sold by
Carter Albert R and Mitchell Micah
Bought by
Zamora Marvin
Home Financials for this Owner
Home Financials are based on the most recent Mortgage that was taken out on this home.
Original Mortgage
$268,000
Outstanding Balance
$204,400
Interest Rate
4.35%
Mortgage Type
New Conventional
Estimated Equity
$357,418
Purchase Details
Closed on
Aug 2, 2005
Sold by
Langon John J and Langon Renee A
Bought by
Hahn Betty J
Home Financials for this Owner
Home Financials are based on the most recent Mortgage that was taken out on this home.
Original Mortgage
$328,000
Interest Rate
5.25%
Mortgage Type
Purchase Money Mortgage
Create a Home Valuation Report for This Property
The Home Valuation Report is an in-depth analysis detailing your home's value as well as a comparison with similar homes in the area
Home Values in the Area
Average Home Value in this Area
Purchase History
| Date | Buyer | Sale Price | Title Company |
|---|---|---|---|
| Zamora Marvin | -- | None Available | |
| Zamora Marvin | $335,000 | Old Republic Title Company | |
| Hahn Betty J | $485,000 | Old Republic Title Company |
Source: Public Records
Mortgage History
| Date | Status | Borrower | Loan Amount |
|---|---|---|---|
| Open | Zamora Marvin | $268,000 | |
| Previous Owner | Hahn Betty J | $328,000 |
Source: Public Records
Tax History Compared to Growth
Tax History
| Year | Tax Paid | Tax Assessment Tax Assessment Total Assessment is a certain percentage of the fair market value that is determined by local assessors to be the total taxable value of land and additions on the property. | Land | Improvement |
|---|---|---|---|---|
| 2025 | $5,603 | $410,645 | $123,193 | $287,452 |
| 2024 | $5,603 | $402,595 | $120,778 | $281,817 |
| 2023 | $5,582 | $394,703 | $118,411 | $276,292 |
| 2022 | $5,495 | $386,964 | $116,089 | $270,875 |
| 2021 | $5,344 | $379,380 | $113,814 | $265,566 |
| 2020 | $5,226 | $375,491 | $112,647 | $262,844 |
| 2019 | $5,199 | $368,131 | $110,439 | $257,692 |
| 2018 | $4,948 | $360,914 | $108,274 | $252,640 |
| 2017 | $4,619 | $353,840 | $106,152 | $247,688 |
| 2016 | $4,459 | $346,901 | $104,070 | $242,831 |
| 2015 | $4,362 | $341,692 | $102,507 | $239,185 |
| 2014 | $4,502 | $360,000 | $108,000 | $252,000 |
Source: Public Records
Map
Nearby Homes
- 16277 Ashland Ave
- 920 Elgin St Unit G
- 1045 Delano St
- 15860 Connolly Ave
- 16006 E 14th St Unit 101
- 15956 E 14th St Unit 303
- 16118 Mateo St
- 1550 162nd Ave Unit 69
- 1550 162nd Ave Unit 47
- 16557 E 14th St
- 527 Colby St
- 1507 Green Ct
- 16829 Daryl Ave
- 181 E Lewelling Blvd
- 1525 Thrush Ave
- 1540 Mono Ave
- 1510 165th Ave
- 179 Loma Verde Dr
- 15539 Usher St
- 15244 Upton Ave
- 16267 Ashland Ave
- 16267 Ashland Ave Unit 4
- 16267 Ashland Ave Unit 2
- 16267 Ashland Ave Unit 6
- 16267 Ashland Ave Unit 1
- 16267 Ashland Ave Unit 5
- 16267 Ashland Ave Unit 8
- 16267 Ashland Ave Unit 7
- 16195 Bertero Ave
- 16247 Bertero Ave
- 16177 Bertero Ave
- 16287 Ashland Ave
- 16220 Bertero Ave
- 16141 Bertero Ave
- 16196 Bertero Ave
- 793 Delano St
- 16245 Ashland Ave
- 787 Delano St
- 16170 Bertero Ave
- 16299 Ashland Ave