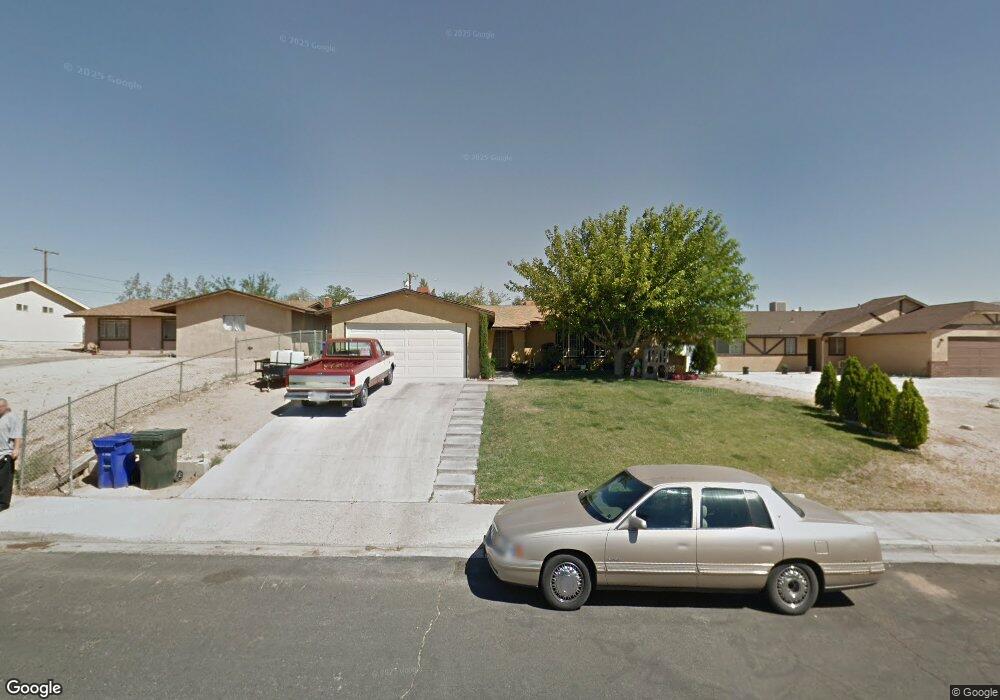
16268 Tawney Ridge Ln Victorville, CA 92394
Estimated Value: $354,000 - $380,000
3
Beds
2
Baths
1,161
Sq Ft
$317/Sq Ft
Est. Value
About This Home
This home is located at 16268 Tawney Ridge Ln, Victorville, CA 92394 and is currently estimated at $367,948, approximately $316 per square foot. 16268 Tawney Ridge Ln is a home located in San Bernardino County with nearby schools including Puesta Del Sol Elementary School, Challenger School Of Sports And Fitness, and Village Elementary School.
Ownership History
Date
Name
Owned For
Owner Type
Purchase Details
Closed on
Nov 18, 2021
Sold by
Hutchison Karlotta K
Bought by
Hutchison Karlotta K and Simpson Leslie
Current Estimated Value
Purchase Details
Closed on
Mar 28, 2000
Sold by
Regions Mtg Inc
Bought by
Hutchison Karlotta K
Home Financials for this Owner
Home Financials are based on the most recent Mortgage that was taken out on this home.
Original Mortgage
$59,119
Outstanding Balance
$20,472
Interest Rate
8.38%
Mortgage Type
FHA
Estimated Equity
$347,476
Purchase Details
Closed on
Nov 23, 1998
Sold by
Trewhella Ronald R and Trewhella Renee M
Bought by
Regions Mtg Inc
Purchase Details
Closed on
Feb 10, 1998
Sold by
Chang Roger W L and Chang Helen F
Bought by
Carr David Curtis
Create a Home Valuation Report for This Property
The Home Valuation Report is an in-depth analysis detailing your home's value as well as a comparison with similar homes in the area
Home Values in the Area
Average Home Value in this Area
Purchase History
| Date | Buyer | Sale Price | Title Company |
|---|---|---|---|
| Hutchison Karlotta K | -- | None Available | |
| Hutchison Karlotta K | $60,000 | Chicago Title Co | |
| Regions Mtg Inc | $45,596 | First American Title Ins Co | |
| Carr David Curtis | -- | First American Title Ins Co |
Source: Public Records
Mortgage History
| Date | Status | Borrower | Loan Amount |
|---|---|---|---|
| Open | Hutchison Karlotta K | $59,119 | |
| Closed | Hutchison Karlotta K | $1,797 |
Source: Public Records
Tax History Compared to Growth
Tax History
| Year | Tax Paid | Tax Assessment Tax Assessment Total Assessment is a certain percentage of the fair market value that is determined by local assessors to be the total taxable value of land and additions on the property. | Land | Improvement |
|---|---|---|---|---|
| 2025 | $1,097 | $92,221 | $15,679 | $76,542 |
| 2024 | $1,097 | $90,413 | $15,372 | $75,041 |
| 2023 | $1,084 | $88,641 | $15,071 | $73,570 |
| 2022 | $1,065 | $86,902 | $14,775 | $72,127 |
| 2021 | $966 | $85,198 | $14,485 | $70,713 |
| 2020 | $947 | $84,324 | $14,336 | $69,988 |
| 2019 | $930 | $82,671 | $14,055 | $68,616 |
| 2018 | $988 | $81,050 | $13,779 | $67,271 |
| 2017 | $967 | $79,461 | $13,509 | $65,952 |
| 2016 | $946 | $77,903 | $13,244 | $64,659 |
| 2015 | $911 | $76,733 | $13,045 | $63,688 |
| 2014 | $892 | $75,229 | $12,789 | $62,440 |
Source: Public Records
Map
Nearby Homes
- 0 Tawney Ridge Ln Unit OC25230542
- 0 Tawney Ridge Ln Unit HD25139011
- 0 Tawney Ridge Ln Unit HD25147670
- 0 Tawney Ridge Ln Unit IV25098039
- 16226 Brookfield Dr
- 16388 Victoria Dr
- 16277 Puesta Del Sol Dr
- 16011 Coronado Dr
- 16028 Green Hill Dr
- 0 Puesta Del Sol Dr Unit HD25159036
- 0 Puesta Del Sol Dr Unit TR25127778
- 16299 Pepper Tree Dr
- 101 Pepper Tree Dr
- 16297 Pepper Tree Dr
- 15960 Green Hill Dr
- 16397 S D St Unit 3
- 0 Cottonwood Ave Unit 24-450591
- 15728 La Paz Dr
- 15580 1st St
- 15975 Village Dr
- 16260 Tawney Ridge Ln
- 16278 Tawney Ridge Ln
- 16252 Tawney Ridge Ln
- 16275 Green Hill Dr
- 16260 Victoria Dr
- 16279 Green Hill Dr
- 16271 Green Hill Dr
- 16285 Green Hill Dr
- 16242 Tawney Ridge Ln
- 16269 Tawney Ridge Ln
- 16279 Tawney Ridge Ln
- 16265 Tawney Ridge Ln
- 16289 Tawney Ridge Ln
- 16267 Green Hill Dr
- 16261 Tawney Ridge Ln
- 16234 Tawney Ridge Ln
- 16297 Tawney Ridge Ln
- 0 Tawney Ridge Ln Unit IV22163423
- 0 Tawney Ridge Ln Unit CV25151951
- 0 Tawney Ridge Ln Unit CRIV25098039