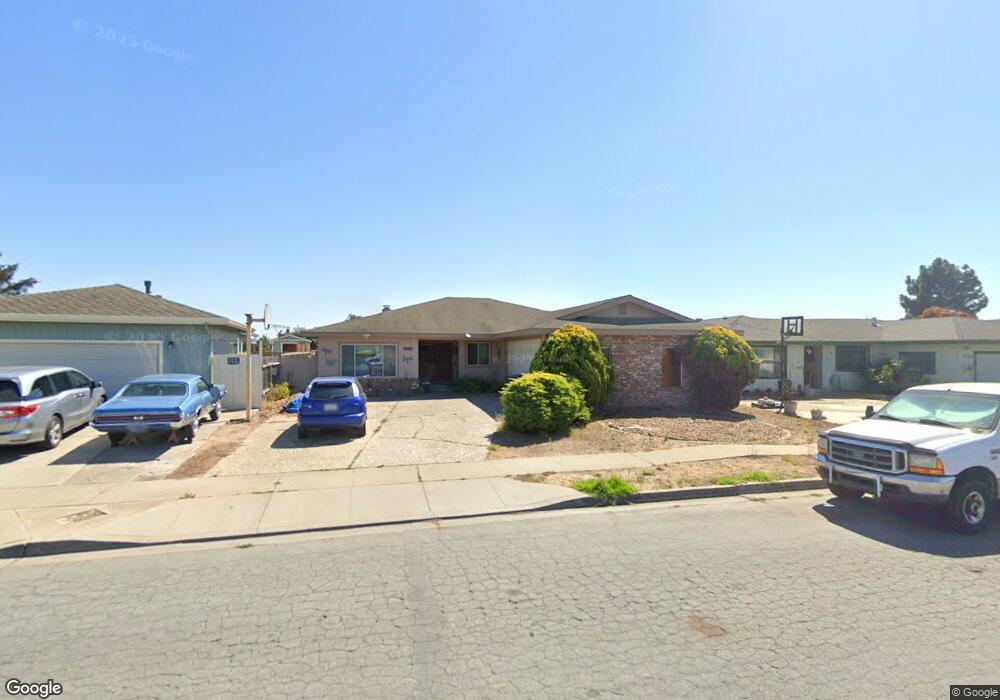
1627 Atherton Way Unit 5 Salinas, CA 93906
Creekbridge NeighborhoodEstimated Value: $816,000 - $978,000
3
Beds
2
Baths
1,928
Sq Ft
$449/Sq Ft
Est. Value
About This Home
This home is located at 1627 Atherton Way Unit 5, Salinas, CA 93906 and is currently estimated at $865,897, approximately $449 per square foot. 1627 Atherton Way Unit 5 is a home located in Monterey County with nearby schools including Loma Vista Elementary School, Natividad Elementary School, and El Gabilan Elementary School.
Ownership History
Date
Name
Owned For
Owner Type
Purchase Details
Closed on
Apr 5, 2001
Sold by
Reavis Anita F
Bought by
Clark Rodney D and Clark Charlene D
Current Estimated Value
Home Financials for this Owner
Home Financials are based on the most recent Mortgage that was taken out on this home.
Original Mortgage
$191,000
Outstanding Balance
$70,777
Interest Rate
7.09%
Estimated Equity
$795,120
Purchase Details
Closed on
Dec 16, 1998
Sold by
Robinson Anita
Bought by
Reavis James and James & Margie Reavis Family T
Purchase Details
Closed on
May 21, 1996
Sold by
Robinson Michael
Bought by
Robinson Anita
Purchase Details
Closed on
May 26, 1994
Sold by
Reavis James
Bought by
Robinson Michael and Robinson Anita
Home Financials for this Owner
Home Financials are based on the most recent Mortgage that was taken out on this home.
Original Mortgage
$125,775
Interest Rate
9.99%
Create a Home Valuation Report for This Property
The Home Valuation Report is an in-depth analysis detailing your home's value as well as a comparison with similar homes in the area
Home Values in the Area
Average Home Value in this Area
Purchase History
| Date | Buyer | Sale Price | Title Company |
|---|---|---|---|
| Clark Rodney D | $295,000 | Old Republic Title Company | |
| Reavis James | -- | -- | |
| Robinson Anita | -- | -- | |
| Robinson Michael | -- | Fidelity National Title Ins |
Source: Public Records
Mortgage History
| Date | Status | Borrower | Loan Amount |
|---|---|---|---|
| Open | Clark Rodney D | $191,000 | |
| Previous Owner | Robinson Michael | $125,775 |
Source: Public Records
Tax History Compared to Growth
Tax History
| Year | Tax Paid | Tax Assessment Tax Assessment Total Assessment is a certain percentage of the fair market value that is determined by local assessors to be the total taxable value of land and additions on the property. | Land | Improvement |
|---|---|---|---|---|
| 2025 | $5,112 | $444,517 | $210,957 | $233,560 |
| 2024 | $5,112 | $435,802 | $206,821 | $228,981 |
| 2023 | $4,938 | $427,258 | $202,766 | $224,492 |
| 2022 | $4,754 | $418,882 | $198,791 | $220,091 |
| 2021 | $4,567 | $410,670 | $194,894 | $215,776 |
| 2020 | $4,441 | $406,460 | $192,896 | $213,564 |
| 2019 | $4,409 | $398,491 | $189,114 | $209,377 |
| 2018 | $4,353 | $390,678 | $185,406 | $205,272 |
| 2017 | $4,357 | $383,019 | $181,771 | $201,248 |
| 2016 | $4,360 | $375,509 | $178,207 | $197,302 |
| 2015 | $4,401 | $369,870 | $175,531 | $194,339 |
| 2014 | $3,495 | $308,000 | $146,000 | $162,000 |
Source: Public Records
Map
Nearby Homes
- 1513 Oyster Bay Ct
- 822 Castleton St
- 1615 Newport Ct
- 734 Los Coches Ave
- 730 Los Coches Ave
- 643 Rainier Dr
- 1049 Twin Creeks Dr
- 1731 Pescadero Dr
- 634 Yreka Dr
- 18 Suffield Cir
- 607 Calaveras Dr
- 1313 Ramona Ave
- 1780 Truckee Way
- 704 Garner Ave Unit 3
- 742 Pino Way
- 1818 Lancashire Dr
- 709 Gee St
- 794 Danbury St
- 1875 Lancashire Dr
- 948 Rider Ave
- 1629 Atherton Way
- 1625 Atherton Way
- 1631 Atherton Way Unit 5
- 1621 Atherton Way
- 1533 Oyster Bay Ct
- 1531 Oyster Bay Ct
- 1535 Oyster Bay Ct
- 1633 Atherton Way
- 1619 Atherton Way
- 1537 Oyster Bay Ct
- 1529 Oyster Bay Ct
- 1626 Atherton Way
- 1539 Oyster Bay Ct
- 1628 Atherton Way
- 1592 Los Altos Way
- 1632 Atherton Way
- 1635 Atherton Way
- 1541 Oyster Bay Ct
- 1527 Oyster Bay Ct
- 1617 Atherton Way