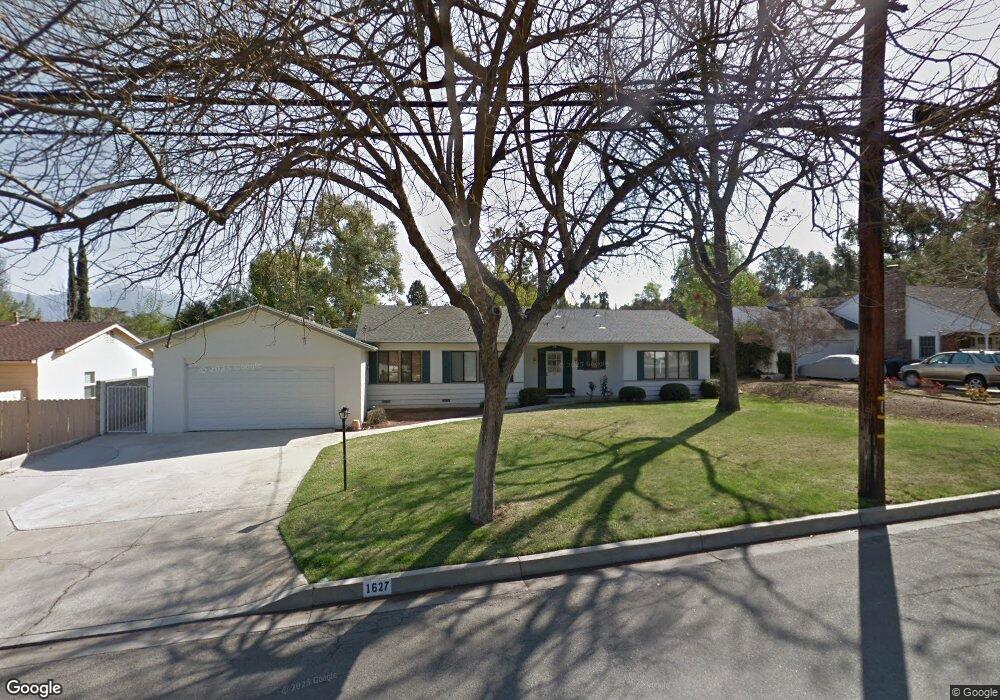
1627 Dwight St Redlands, CA 92373
South Redlands NeighborhoodEstimated Value: $745,031 - $893,000
3
Beds
3
Baths
1,944
Sq Ft
$426/Sq Ft
Est. Value
About This Home
This home is located at 1627 Dwight St, Redlands, CA 92373 and is currently estimated at $827,508, approximately $425 per square foot. 1627 Dwight St is a home located in San Bernardino County with nearby schools including Kimberly Elementary School, Cope Middle School, and Redlands Senior High School.
Ownership History
Date
Name
Owned For
Owner Type
Purchase Details
Closed on
Oct 3, 2011
Sold by
Brown Linda R
Bought by
Brown Linda R and Linda R Brown Trust
Current Estimated Value
Purchase Details
Closed on
Oct 2, 2003
Sold by
Brown Terrance
Bought by
Brown Terrance L and Brown Linda R
Home Financials for this Owner
Home Financials are based on the most recent Mortgage that was taken out on this home.
Original Mortgage
$164,000
Interest Rate
5.12%
Mortgage Type
Purchase Money Mortgage
Purchase Details
Closed on
Aug 22, 2003
Sold by
Brown Linda R
Bought by
Brown Terrance L
Home Financials for this Owner
Home Financials are based on the most recent Mortgage that was taken out on this home.
Original Mortgage
$164,000
Interest Rate
5.12%
Mortgage Type
Purchase Money Mortgage
Create a Home Valuation Report for This Property
The Home Valuation Report is an in-depth analysis detailing your home's value as well as a comparison with similar homes in the area
Home Values in the Area
Average Home Value in this Area
Purchase History
| Date | Buyer | Sale Price | Title Company |
|---|---|---|---|
| Brown Linda R | -- | None Available | |
| Brown Terrance L | -- | -- | |
| Brown Terrance L | -- | Chicago |
Source: Public Records
Mortgage History
| Date | Status | Borrower | Loan Amount |
|---|---|---|---|
| Closed | Brown Terrance L | $164,000 |
Source: Public Records
Tax History
| Year | Tax Paid | Tax Assessment Tax Assessment Total Assessment is a certain percentage of the fair market value that is determined by local assessors to be the total taxable value of land and additions on the property. | Land | Improvement |
|---|---|---|---|---|
| 2025 | $3,408 | $279,462 | $66,998 | $212,464 |
| 2024 | $3,182 | $273,982 | $65,684 | $208,298 |
| 2023 | $3,177 | $268,610 | $64,396 | $204,214 |
| 2022 | $3,129 | $263,343 | $63,133 | $200,210 |
| 2021 | $3,184 | $258,179 | $61,895 | $196,284 |
| 2020 | $3,136 | $255,531 | $61,260 | $194,271 |
| 2019 | $3,047 | $250,521 | $60,059 | $190,462 |
| 2018 | $2,970 | $245,608 | $58,881 | $186,727 |
| 2017 | $2,943 | $240,792 | $57,726 | $183,066 |
| 2016 | $2,909 | $236,070 | $56,594 | $179,476 |
| 2015 | $2,886 | $232,524 | $55,744 | $176,780 |
| 2014 | $2,832 | $227,969 | $54,652 | $173,317 |
Source: Public Records
Map
Nearby Homes
- 1631 Benita Marie Crest
- 1617 Garden St
- 1702 Dwight St
- 0 Garden St Unit EV23054640
- 1525 Garden St
- 1514 Franklin Ave
- 1641 Ford St
- 745 W Sunset Dr
- 724 W Sunset Dr
- 848 W Sunset Dr
- 1400 Elizabeth St
- 225 Sunset Dr
- 1377 Knoll Rd
- 116 Franklin Ave
- 1388 Brandon Ct
- 1370 Oak St
- 505 E Sunset Dr N
- 1349 S Center St
- 1805 Canyon Rd
- 533 Via Vista Dr
Your Personal Tour Guide
Ask me questions while you tour the home.