1627 Riparian Dr Naperville, IL 60565
Winding Creek Estates NeighborhoodEstimated Value: $907,000 - $972,358
4
Beds
4
Baths
3,499
Sq Ft
$267/Sq Ft
Est. Value
About This Home
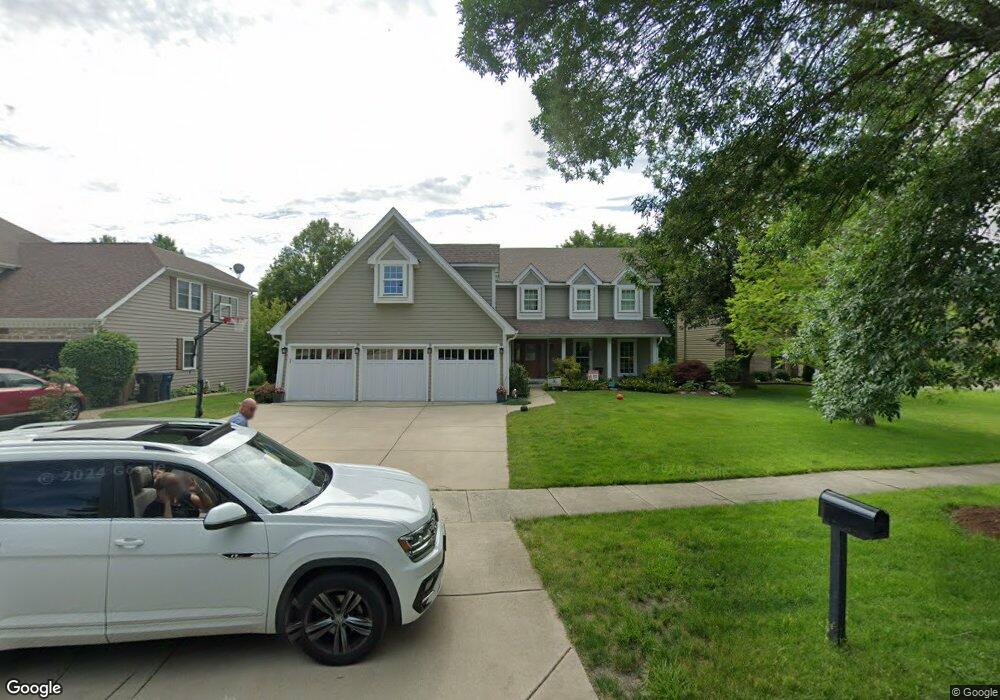
This home is located at 1627 Riparian Dr, Naperville, IL 60565 and is currently estimated at $934,840, approximately $267 per square foot. 1627 Riparian Dr is a home located in DuPage County with nearby schools including Maplebrook Elementary School, Lincoln Jr. High School, and Naperville Central High School.
Ownership History
Date
Name
Owned For
Owner Type
Purchase Details
Closed on
Jan 28, 2021
Sold by
Laclair John C and Laclair Laura
Bought by
Laclair John C and Laclair Laura
Current Estimated Value
Purchase Details
Closed on
Nov 24, 2008
Sold by
Lynch John and Lynch Roseanne
Bought by
Laclair John C and Laclair Laura
Home Financials for this Owner
Home Financials are based on the most recent Mortgage that was taken out on this home.
Original Mortgage
$412,800
Outstanding Balance
$271,554
Interest Rate
6.04%
Mortgage Type
Purchase Money Mortgage
Estimated Equity
$663,286
Purchase Details
Closed on
Jul 29, 1999
Sold by
Nolan Deborah
Bought by
Lynch John and Lynch Roseanne
Home Financials for this Owner
Home Financials are based on the most recent Mortgage that was taken out on this home.
Original Mortgage
$239,400
Interest Rate
7.25%
Purchase Details
Closed on
Oct 26, 1998
Sold by
Nolan Deborah and Nolan Craig
Bought by
Nolan Deborah
Create a Home Valuation Report for This Property
The Home Valuation Report is an in-depth analysis detailing your home's value as well as a comparison with similar homes in the area
Home Values in the Area
Average Home Value in this Area
Purchase History
| Date | Buyer | Sale Price | Title Company |
|---|---|---|---|
| Laclair John C | -- | Attorney | |
| Laclair John C | $516,000 | Atg | |
| Lynch John | $239,500 | -- | |
| Nolan Deborah | -- | -- |
Source: Public Records
Mortgage History
| Date | Status | Borrower | Loan Amount |
|---|---|---|---|
| Open | Laclair John C | $412,800 | |
| Previous Owner | Lynch John | $239,400 |
Source: Public Records
Tax History Compared to Growth
Tax History
| Year | Tax Paid | Tax Assessment Tax Assessment Total Assessment is a certain percentage of the fair market value that is determined by local assessors to be the total taxable value of land and additions on the property. | Land | Improvement |
|---|---|---|---|---|
| 2024 | $14,577 | $245,952 | $86,254 | $159,698 |
| 2023 | $14,066 | $224,470 | $78,720 | $145,750 |
| 2022 | $12,885 | $205,090 | $71,920 | $133,170 |
| 2021 | $12,419 | $197,330 | $69,200 | $128,130 |
| 2020 | $12,157 | $193,790 | $67,960 | $125,830 |
| 2019 | $11,809 | $185,410 | $65,020 | $120,390 |
| 2018 | $11,812 | $185,410 | $65,020 | $120,390 |
| 2017 | $11,580 | $179,160 | $62,830 | $116,330 |
| 2016 | $11,353 | $172,680 | $60,560 | $112,120 |
| 2015 | $11,289 | $162,610 | $57,030 | $105,580 |
| 2014 | $11,420 | $159,420 | $55,910 | $103,510 |
| 2013 | $11,247 | $159,800 | $56,040 | $103,760 |
Source: Public Records
Map
Nearby Homes
- 303 Cedarbrook Rd
- 1443 Meander Dr
- 1967 Bristol Ct
- 1948 Navarone Dr
- 213 Winding Creek Dr
- 344 Waxwing Ave
- 2167 Countryside Cir
- 1921 Wisteria Ct Unit 3
- 445 Travelaire Ave
- 1751 S Washington St Unit 1
- 47 Glencoe Ct Unit 102D
- 2132 Berkley Ct Unit 201A
- 221 Hampshire Ct Unit 201D
- 23 Glencoe Ct Unit 202B
- 2337 Worthing Dr Unit 102A
- 1408 Swallow St
- 128 E Bailey Rd Unit G
- 138 E Bailey Rd Unit M
- 2206 Gleneagles Dr
- 158 E Bailey Rd Unit F
- 1631 Riparian Dr
- 1623 Riparian Dr
- 1635 Riparian Dr
- 1619 Riparian Dr
- 501 Peacock Ct
- 1639 Riparian Dr
- 500 Peacock Ct
- 1628 Riparian Dr
- 1615 Riparian Dr
- 1618 Riparian Dr
- 430 Redstart Rd
- 1632 Riparian Dr Unit 5
- 505 Peacock Ct
- 1645 Riparian Dr Unit 5
- 433 Redstart Rd
- 1636 Riparian Dr
- 504 Peacock Ct
- 1610 Riparian Dr
- 454 Quail Dr
- 446 Quail Dr