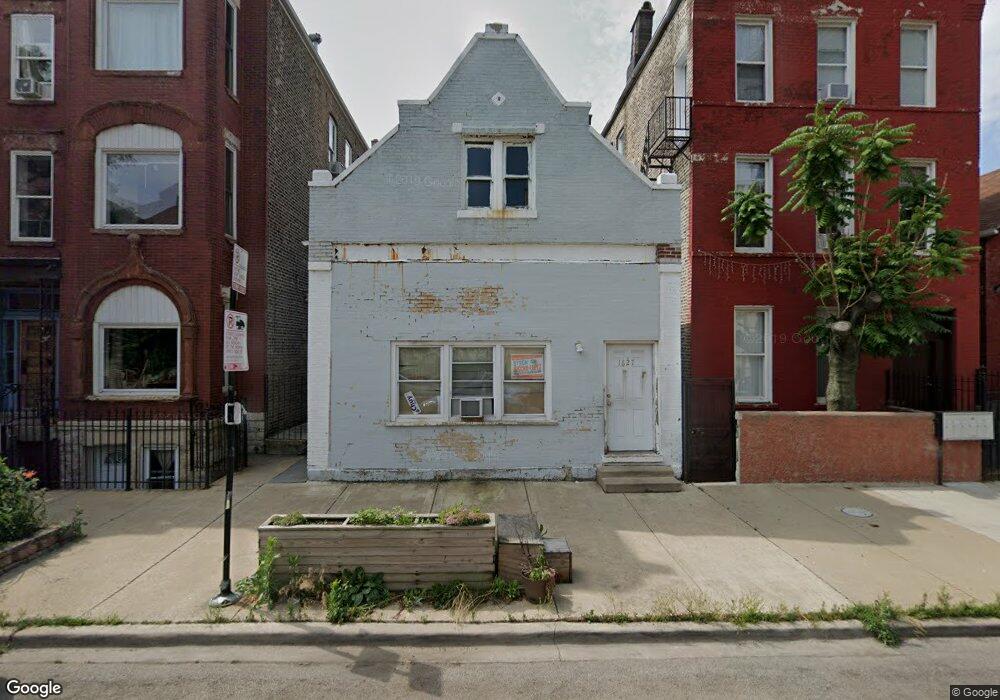
1627 W 17th St Chicago, IL 60608
Heart of Chicago NeighborhoodEstimated Value: $388,000 - $429,000
3
Beds
1
Bath
1,540
Sq Ft
$264/Sq Ft
Est. Value
About This Home
This home is located at 1627 W 17th St, Chicago, IL 60608 and is currently estimated at $406,118, approximately $263 per square foot. 1627 W 17th St is a home located in Cook County with nearby schools including Juarez Community Academy High School, Acero - Bartolomé de Las Casas Elementary School, and St. Pius V. School.
Ownership History
Date
Name
Owned For
Owner Type
Purchase Details
Closed on
Sep 13, 2003
Sold by
Sanchez Sylvia and Garcia Jose De Jesus
Bought by
Garcia Jose De Jesus and Sanchez Sylvia
Current Estimated Value
Home Financials for this Owner
Home Financials are based on the most recent Mortgage that was taken out on this home.
Original Mortgage
$105,500
Interest Rate
6.43%
Mortgage Type
Unknown
Purchase Details
Closed on
Feb 2, 1999
Sold by
Mendez Angel M and Mendez Maria C
Bought by
Garcia Jose Dejesus and Sanchez Sylvia
Home Financials for this Owner
Home Financials are based on the most recent Mortgage that was taken out on this home.
Original Mortgage
$64,900
Interest Rate
6.94%
Mortgage Type
FHA
Purchase Details
Closed on
Jun 17, 1994
Sold by
Garcia Ruben and Garcia Debbie
Bought by
Mendez Angel and Mendez Maria C
Home Financials for this Owner
Home Financials are based on the most recent Mortgage that was taken out on this home.
Original Mortgage
$48,000
Interest Rate
8.78%
Create a Home Valuation Report for This Property
The Home Valuation Report is an in-depth analysis detailing your home's value as well as a comparison with similar homes in the area
Home Values in the Area
Average Home Value in this Area
Purchase History
| Date | Buyer | Sale Price | Title Company |
|---|---|---|---|
| Garcia Jose De Jesus | -- | -- | |
| Garcia Jose Dejesus | $65,000 | Professional National Title | |
| Mendez Angel | $60,000 | -- |
Source: Public Records
Mortgage History
| Date | Status | Borrower | Loan Amount |
|---|---|---|---|
| Closed | Garcia Jose De Jesus | $105,500 | |
| Previous Owner | Garcia Jose Dejesus | $64,900 | |
| Previous Owner | Mendez Angel | $48,000 |
Source: Public Records
Tax History Compared to Growth
Tax History
| Year | Tax Paid | Tax Assessment Tax Assessment Total Assessment is a certain percentage of the fair market value that is determined by local assessors to be the total taxable value of land and additions on the property. | Land | Improvement |
|---|---|---|---|---|
| 2024 | $6,068 | $38,001 | $11,563 | $26,438 |
| 2023 | $8,844 | $32,906 | $9,375 | $23,531 |
| 2022 | $8,844 | $43,000 | $9,375 | $33,625 |
| 2021 | $8,647 | $43,000 | $9,375 | $33,625 |
| 2020 | $6,491 | $29,139 | $7,343 | $21,796 |
| 2019 | $6,505 | $32,377 | $7,343 | $25,034 |
| 2018 | $6,396 | $32,377 | $7,343 | $25,034 |
| 2017 | $4,645 | $21,577 | $6,406 | $15,171 |
| 2016 | $4,322 | $21,577 | $6,406 | $15,171 |
| 2015 | $3,954 | $21,577 | $6,406 | $15,171 |
| 2014 | $3,330 | $17,945 | $5,625 | $12,320 |
| 2013 | $3,264 | $17,945 | $5,625 | $12,320 |
Source: Public Records
Map
Nearby Homes
- 1645 W 17th St
- 1817 S Ashland Ave
- 1521 W 17th St Unit 2
- 1116 W 18th St
- 2029 W 17th St
- 1727 W 19th St
- 1538 W 21st St Unit 3A
- 1538 W 21st St Unit 1
- 1538 W 21st St Unit 2
- 1756 W Cullerton St Unit 3
- 5226 S Loomis St
- 1615 W 15th St
- 1355 W 16th St
- 1823 W Cullerton St
- 1635 W 21st Place Unit 1
- 1635 W 21st Place Unit 2
- 1635 W 21st Place Unit 3
- 2735 W 16th St
- 1639 S Blue Island Ave
- 1326 W 18th Place
- 1627 W 17th St Unit 1F
- 1623 W 17th St Unit 123
- 1623 W 17th St
- 1629 W 17th St
- 1631 W 17th St
- 1621 W 17th St Unit 1
- 1635 W 17th St Unit 2
- 1619 W 17th St Unit 2
- 1637 W 17th St
- 1639 W 17th St
- 1800 W 17th St
- 1641 W 17th St
- 1628 W 18th St
- 1616 W 18th St Unit 1
- 1616 W 18th St Unit 4AE
- 1616 W 18th St Unit 1AE
- 1616 W 18th St Unit A3
- 1616 W 18th St Unit 3AE
- 1616 W 18th St
- 1626 W 18th St Unit 1