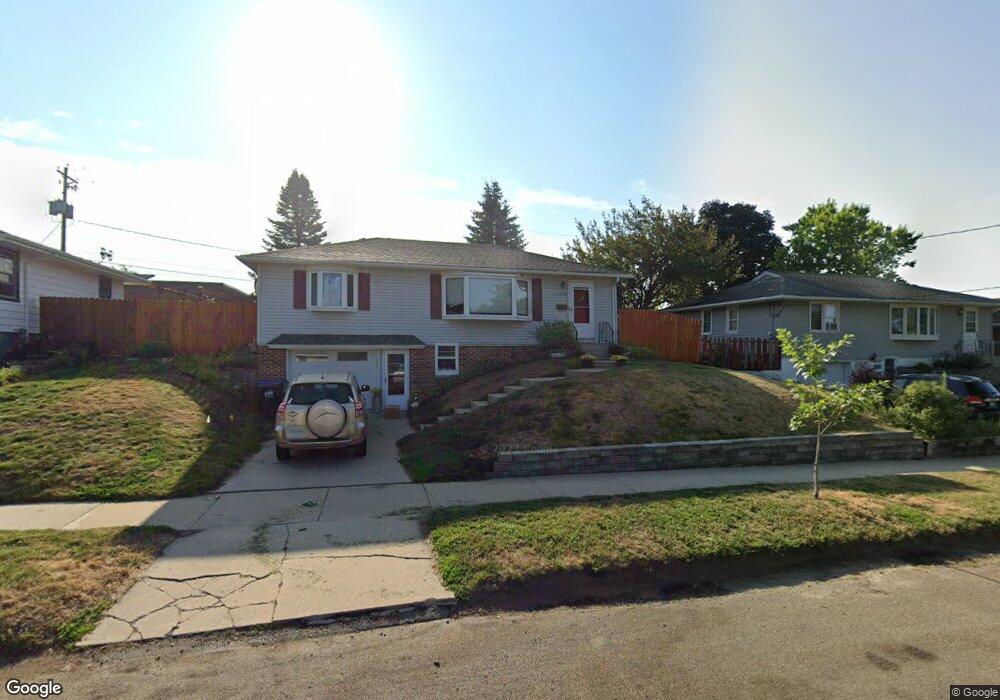
1628 18th Ave NW Rochester, MN 55901
Estimated Value: $246,000 - $270,000
3
Beds
2
Baths
960
Sq Ft
$272/Sq Ft
Est. Value
About This Home
This home is located at 1628 18th Ave NW, Rochester, MN 55901 and is currently estimated at $260,986, approximately $271 per square foot. 1628 18th Ave NW is a home located in Olmsted County with nearby schools including Sunset Terrace Elementary School, John Adams Middle School, and John Marshall Senior High School.
Ownership History
Date
Name
Owned For
Owner Type
Purchase Details
Closed on
May 19, 2020
Sold by
Bucknell Daniel E and Bucknell Mary
Bought by
Bucknell Daniel E and Bucknell Mary
Current Estimated Value
Home Financials for this Owner
Home Financials are based on the most recent Mortgage that was taken out on this home.
Original Mortgage
$103,785
Outstanding Balance
$91,968
Interest Rate
3.3%
Mortgage Type
FHA
Estimated Equity
$169,018
Purchase Details
Closed on
Jul 12, 2006
Sold by
Deutsche Bank National Trust Company
Bought by
Bucknell Daniel E
Home Financials for this Owner
Home Financials are based on the most recent Mortgage that was taken out on this home.
Original Mortgage
$125,500
Interest Rate
6.78%
Mortgage Type
New Conventional
Purchase Details
Closed on
Dec 15, 2005
Sold by
Joseph Anthony and Joseph Linda
Bought by
Deutsche Bank National Trust Company
Create a Home Valuation Report for This Property
The Home Valuation Report is an in-depth analysis detailing your home's value as well as a comparison with similar homes in the area
Home Values in the Area
Average Home Value in this Area
Purchase History
| Date | Buyer | Sale Price | Title Company |
|---|---|---|---|
| Bucknell Daniel E | -- | None Available | |
| Bucknell Daniel E | $125,606 | West Title Llc | |
| Deutsche Bank National Trust Company | $197,331 | None Available |
Source: Public Records
Mortgage History
| Date | Status | Borrower | Loan Amount |
|---|---|---|---|
| Open | Bucknell Daniel E | $103,785 | |
| Closed | Bucknell Daniel E | $125,500 |
Source: Public Records
Tax History Compared to Growth
Tax History
| Year | Tax Paid | Tax Assessment Tax Assessment Total Assessment is a certain percentage of the fair market value that is determined by local assessors to be the total taxable value of land and additions on the property. | Land | Improvement |
|---|---|---|---|---|
| 2024 | $2,864 | $226,100 | $40,000 | $186,100 |
| 2023 | $2,538 | $216,800 | $40,000 | $176,800 |
| 2022 | $2,324 | $212,500 | $40,000 | $172,500 |
| 2021 | $2,172 | $180,300 | $35,000 | $145,300 |
| 2020 | $2,218 | $169,600 | $35,000 | $134,600 |
| 2019 | $1,904 | $167,000 | $35,000 | $132,000 |
| 2018 | $1,596 | $147,000 | $25,000 | $122,000 |
| 2017 | $1,530 | $136,700 | $25,000 | $111,700 |
| 2016 | $1,552 | $100,700 | $19,900 | $80,800 |
| 2015 | $1,462 | $100,300 | $19,900 | $80,400 |
| 2014 | $1,394 | $101,500 | $19,900 | $81,600 |
| 2012 | -- | $99,400 | $19,817 | $79,583 |
Source: Public Records
Map
Nearby Homes
- 2010 16 1 2 St NW
- 2032 Valleyhigh Dr NW
- 2106 Valleyhigh Dr NW Unit A202
- 2223 Valleyhigh Dr NW
- 2411 18 1 2 St NW
- 2021 22nd St NW
- 2010 13th Ave NW
- 1015 12th St NW
- 2408 22nd St NW
- 2028 Telemark Ct NW
- 1213 8th Ave NW
- 727 14th St NW
- 2225 Fisher Ct NW
- 2509 11th Ave NW
- 625 19th St NW Unit 603
- 913 7th St NW
- 909 7th St NW
- 1207 7th Ave NW
- 812 9th Ave NW
- 1125 7th Ave NW
- 1632 18th Ave NW
- 1620 18th Ave NW
- 1638 18th Ave NW
- 1614 18th Ave NW
- 1631 18th Ave NW
- 1615 18th Ave NW
- 1644 18th Ave NW
- 1608 18th Ave NW
- 1807 16 1/2 St NW
- 1641 18th Ave NW
- 1807 16 1 2 St NW
- 1806 16 1/2 St NW
- 1806 16 1 2 St NW
- 1702 1702 18th-Avenue-nw
- 1806 17th St NW
- 1604 18th Ave NW
- 1813 16 1/2 St NW
- 1702 18th Ave NW
- 1813 16 1 2 St NW
- 1605 18th Ave NW