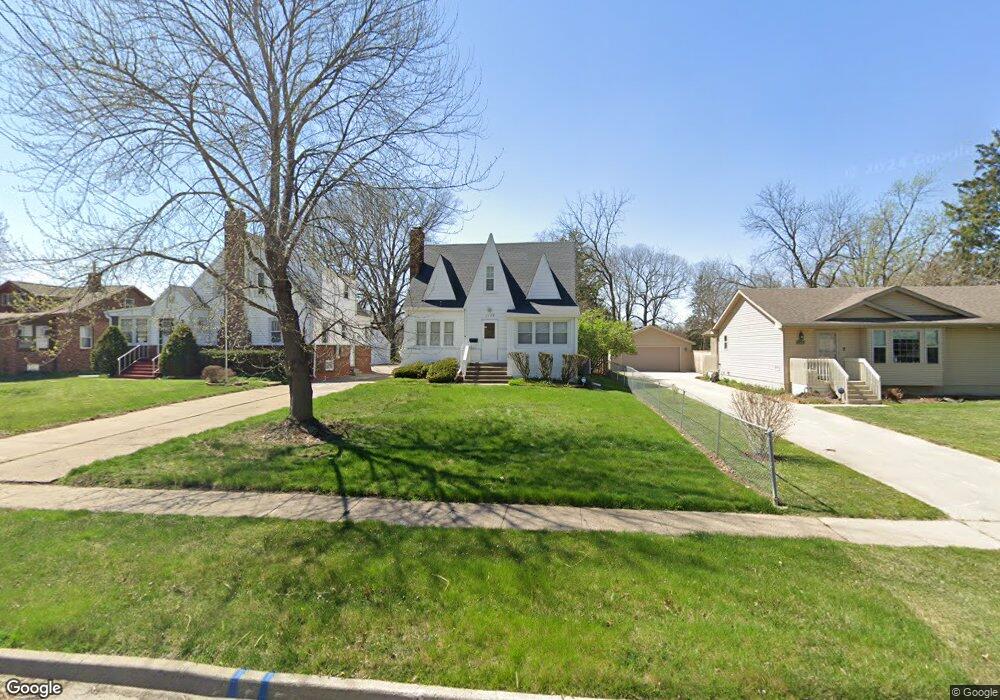
1628 48th St Des Moines, IA 50310
Waveland Park NeighborhoodEstimated Value: $226,000 - $294,000
3
Beds
2
Baths
1,425
Sq Ft
$176/Sq Ft
Est. Value
About This Home
This home is located at 1628 48th St, Des Moines, IA 50310 and is currently estimated at $250,199, approximately $175 per square foot. 1628 48th St is a home located in Polk County with nearby schools including Perkins Elementary School, Merrill Middle School, and Roosevelt High School.
Ownership History
Date
Name
Owned For
Owner Type
Purchase Details
Closed on
Sep 26, 2022
Sold by
Des Moines Masonic Cemetery Association
Bought by
Andrews Susan
Current Estimated Value
Purchase Details
Closed on
Aug 11, 2001
Sold by
Pfeifer Denise G and Jones Janet M
Bought by
Andrews Susan D
Home Financials for this Owner
Home Financials are based on the most recent Mortgage that was taken out on this home.
Original Mortgage
$103,120
Interest Rate
7.23%
Purchase Details
Closed on
Sep 15, 1997
Sold by
Mcpherson Gregory F and Mcpherson Beth A
Bought by
Pfeifer Denise G and Jones Janet M
Home Financials for this Owner
Home Financials are based on the most recent Mortgage that was taken out on this home.
Original Mortgage
$77,500
Interest Rate
7.54%
Create a Home Valuation Report for This Property
The Home Valuation Report is an in-depth analysis detailing your home's value as well as a comparison with similar homes in the area
Home Values in the Area
Average Home Value in this Area
Purchase History
| Date | Buyer | Sale Price | Title Company |
|---|---|---|---|
| Andrews Susan | $19,000 | -- | |
| Andrews Susan D | $128,500 | -- | |
| Pfeifer Denise G | $96,500 | -- |
Source: Public Records
Mortgage History
| Date | Status | Borrower | Loan Amount |
|---|---|---|---|
| Previous Owner | Andrews Susan D | $103,120 | |
| Previous Owner | Pfeifer Denise G | $77,500 | |
| Closed | Andrews Susan D | $19,335 |
Source: Public Records
Tax History Compared to Growth
Tax History
| Year | Tax Paid | Tax Assessment Tax Assessment Total Assessment is a certain percentage of the fair market value that is determined by local assessors to be the total taxable value of land and additions on the property. | Land | Improvement |
|---|---|---|---|---|
| 2025 | $3,818 | $230,700 | $46,200 | $184,500 |
| 2024 | $3,818 | $204,500 | $40,700 | $163,800 |
| 2023 | $3,910 | $204,500 | $40,700 | $163,800 |
| 2022 | $3,878 | $174,800 | $36,700 | $138,100 |
| 2021 | $3,658 | $174,800 | $36,700 | $138,100 |
| 2020 | $3,796 | $155,200 | $32,700 | $122,500 |
| 2019 | $3,434 | $155,200 | $32,700 | $122,500 |
| 2018 | $3,394 | $136,300 | $28,600 | $107,700 |
| 2017 | $3,042 | $136,300 | $28,600 | $107,700 |
| 2016 | $2,958 | $121,000 | $24,900 | $96,100 |
| 2015 | $2,958 | $121,000 | $24,900 | $96,100 |
| 2014 | $2,824 | $115,000 | $23,300 | $91,700 |
Source: Public Records
Map
Nearby Homes