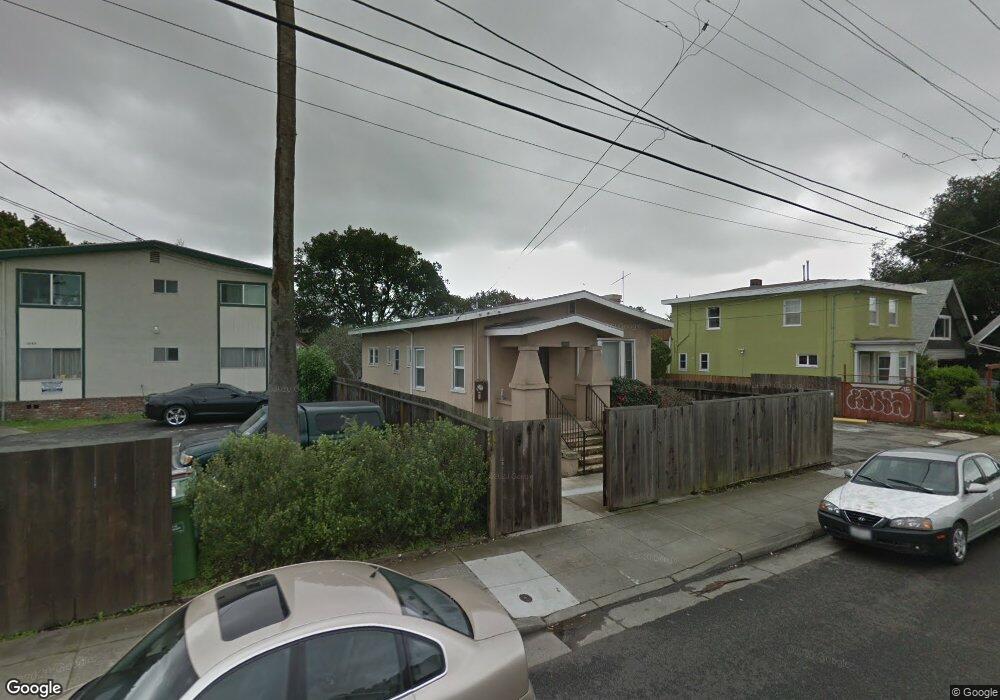
1628 Ashby Ave Berkeley, CA 94703
South Berkeley NeighborhoodEstimated Value: $1,134,000 - $1,376,000
6
Beds
4
Baths
2,652
Sq Ft
$468/Sq Ft
Est. Value
About This Home
This home is located at 1628 Ashby Ave, Berkeley, CA 94703 and is currently estimated at $1,240,333, approximately $467 per square foot. 1628 Ashby Ave is a home located in Alameda County with nearby schools including Malcolm X Elementary School, Emerson Elementary School, and John Muir Elementary School.
Ownership History
Date
Name
Owned For
Owner Type
Purchase Details
Closed on
Mar 4, 2025
Sold by
Liu Mark F
Bought by
Liu Mark F
Current Estimated Value
Home Financials for this Owner
Home Financials are based on the most recent Mortgage that was taken out on this home.
Original Mortgage
$250,000
Outstanding Balance
$248,743
Interest Rate
6.96%
Mortgage Type
Credit Line Revolving
Estimated Equity
$991,590
Purchase Details
Closed on
Feb 1, 2011
Sold by
Deutsche Bank National Trust Company
Bought by
Liu Mark
Purchase Details
Closed on
May 4, 2010
Sold by
Dolphin Linda
Bought by
Deutsche Bank National Trust Company
Purchase Details
Closed on
Aug 30, 2006
Sold by
Mcgovern Catherine
Bought by
Dolphin Linda
Home Financials for this Owner
Home Financials are based on the most recent Mortgage that was taken out on this home.
Original Mortgage
$712,000
Interest Rate
6.25%
Mortgage Type
Balloon
Purchase Details
Closed on
Dec 22, 2005
Sold by
Laam Lp
Bought by
Mcgovern Catherine
Home Financials for this Owner
Home Financials are based on the most recent Mortgage that was taken out on this home.
Original Mortgage
$572,000
Interest Rate
10.35%
Mortgage Type
Fannie Mae Freddie Mac
Purchase Details
Closed on
Jul 7, 2004
Sold by
Ming Harry and Harry Ming Living Trust
Bought by
Laam Lp
Purchase Details
Closed on
Jul 11, 2001
Sold by
Harper Charlotte Ann
Bought by
Ming Harry
Home Financials for this Owner
Home Financials are based on the most recent Mortgage that was taken out on this home.
Original Mortgage
$306,000
Interest Rate
7.21%
Purchase Details
Closed on
May 20, 1994
Sold by
Mitchell Charlotte Ann
Bought by
Harper Charlotte Ann
Home Financials for this Owner
Home Financials are based on the most recent Mortgage that was taken out on this home.
Original Mortgage
$79,000
Interest Rate
5.75%
Create a Home Valuation Report for This Property
The Home Valuation Report is an in-depth analysis detailing your home's value as well as a comparison with similar homes in the area
Home Values in the Area
Average Home Value in this Area
Purchase History
| Date | Buyer | Sale Price | Title Company |
|---|---|---|---|
| Liu Mark F | -- | Chicago Title | |
| Liu Mark F | -- | Chicago Title | |
| Liu Mark | $361,000 | Chicago Title Company | |
| Deutsche Bank National Trust Company | $320,000 | Accommodation | |
| Dolphin Linda | $890,000 | Chicago Title Co | |
| Mcgovern Catherine | $715,000 | Chicago Title Company | |
| Laam Lp | -- | -- | |
| Aparicio Mason Jeannie | -- | -- | |
| Ming Harry | -- | -- | |
| Ming Harry | $360,000 | -- | |
| Harper Charlotte Ann | -- | American Title Insurance Co |
Source: Public Records
Mortgage History
| Date | Status | Borrower | Loan Amount |
|---|---|---|---|
| Open | Liu Mark F | $250,000 | |
| Previous Owner | Dolphin Linda | $712,000 | |
| Previous Owner | Mcgovern Catherine | $572,000 | |
| Previous Owner | Ming Harry | $306,000 | |
| Previous Owner | Harper Charlotte Ann | $79,000 |
Source: Public Records
Tax History
| Year | Tax Paid | Tax Assessment Tax Assessment Total Assessment is a certain percentage of the fair market value that is determined by local assessors to be the total taxable value of land and additions on the property. | Land | Improvement |
|---|---|---|---|---|
| 2025 | $13,029 | $462,476 | $138,743 | $323,733 |
| 2024 | $13,029 | $453,411 | $136,023 | $317,388 |
| 2023 | $12,489 | $444,524 | $133,357 | $311,167 |
| 2022 | $11,941 | $435,810 | $130,743 | $305,067 |
| 2021 | $11,908 | $427,264 | $128,179 | $299,085 |
| 2020 | $11,203 | $422,885 | $126,865 | $296,020 |
| 2019 | $10,646 | $414,597 | $124,379 | $290,218 |
| 2018 | $10,377 | $406,471 | $121,941 | $284,530 |
| 2017 | $9,991 | $398,504 | $119,551 | $278,953 |
| 2016 | $9,538 | $390,691 | $117,207 | $273,484 |
| 2015 | $9,394 | $384,825 | $115,447 | $269,378 |
| 2014 | $9,448 | $377,287 | $113,186 | $264,101 |
Source: Public Records
Map
Nearby Homes
- 1646 Ashby Ave
- 1535 Julia St
- 2926 Ellis St
- 3110 California St
- 3114 California St
- 1507 Prince St
- 3101 Sacramento St
- 3138 California St
- 2922 Stanton St
- 1530 Stuart St
- 3214 California St
- 2790 Sacramento St
- 3233 Ellis St
- 2782 Sacramento St
- 2727 McGee Ave
- 2774 Sacramento St
- 3224 Sacramento St
- 2758 Sacramento St
- 2750 Sacramento St
- 1450 Ward St
Your Personal Tour Guide
Ask me questions while you tour the home.