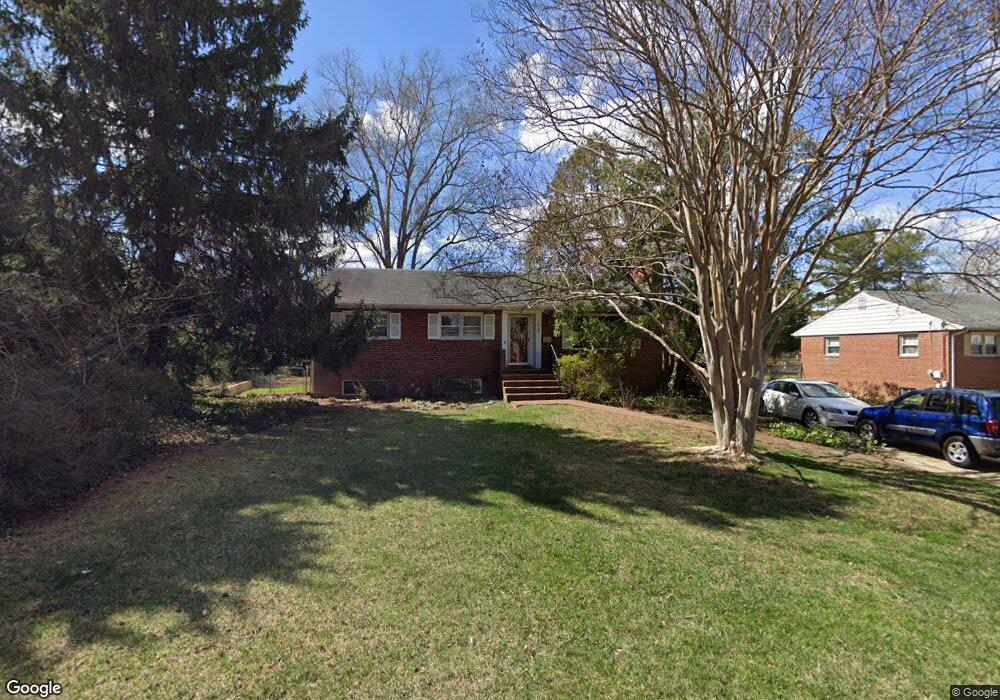
1628 Craig Ln McLean, VA 22101
Estimated Value: $1,275,865 - $3,033,000
7
Beds
8
Baths
8,322
Sq Ft
$225/Sq Ft
Est. Value
About This Home
This home is located at 1628 Craig Ln, McLean, VA 22101 and is currently estimated at $1,868,966, approximately $224 per square foot. 1628 Craig Ln is a home located in Fairfax County with nearby schools including Kent Gardens Elementary School, Longfellow Middle School, and McLean High School.
Ownership History
Date
Name
Owned For
Owner Type
Purchase Details
Closed on
Feb 6, 2025
Sold by
Sanders-Smith Kenneth C and Sanders-Smith Melanie S
Bought by
Anchor Homes Llc
Current Estimated Value
Home Financials for this Owner
Home Financials are based on the most recent Mortgage that was taken out on this home.
Original Mortgage
$1,785,000
Outstanding Balance
$1,774,269
Interest Rate
6.85%
Mortgage Type
Credit Line Revolving
Estimated Equity
$94,697
Purchase Details
Closed on
Jul 28, 2006
Sold by
Jacob Georges Raoul
Bought by
Sanders-Smith Kenneth C
Home Financials for this Owner
Home Financials are based on the most recent Mortgage that was taken out on this home.
Original Mortgage
$532,000
Interest Rate
6.67%
Mortgage Type
New Conventional
Create a Home Valuation Report for This Property
The Home Valuation Report is an in-depth analysis detailing your home's value as well as a comparison with similar homes in the area
Home Values in the Area
Average Home Value in this Area
Purchase History
| Date | Buyer | Sale Price | Title Company |
|---|---|---|---|
| Anchor Homes Llc | $1,200,000 | Commonwealth Land Title | |
| Anchor Homes Llc | $1,200,000 | Commonwealth Land Title | |
| Sanders-Smith Kenneth C | $665,000 | -- |
Source: Public Records
Mortgage History
| Date | Status | Borrower | Loan Amount |
|---|---|---|---|
| Open | Anchor Homes Llc | $1,785,000 | |
| Closed | Anchor Homes Llc | $1,785,000 | |
| Previous Owner | Sanders-Smith Kenneth C | $532,000 |
Source: Public Records
Tax History
| Year | Tax Paid | Tax Assessment Tax Assessment Total Assessment is a certain percentage of the fair market value that is determined by local assessors to be the total taxable value of land and additions on the property. | Land | Improvement |
|---|---|---|---|---|
| 2025 | $11,786 | $1,121,420 | $604,000 | $517,420 |
| 2024 | $11,786 | $997,510 | $589,000 | $408,510 |
| 2023 | $11,295 | $980,920 | $589,000 | $391,920 |
| 2022 | $10,236 | $877,460 | $489,000 | $388,460 |
| 2021 | $9,704 | $810,990 | $457,000 | $353,990 |
| 2020 | $9,456 | $783,720 | $457,000 | $326,720 |
| 2019 | $9,163 | $759,500 | $444,000 | $315,500 |
| 2018 | $8,698 | $756,380 | $444,000 | $312,380 |
| 2017 | $8,550 | $722,110 | $436,000 | $286,110 |
| 2016 | $8,610 | $728,740 | $436,000 | $292,740 |
| 2015 | $7,948 | $697,800 | $419,000 | $278,800 |
| 2014 | $7,136 | $627,920 | $384,000 | $243,920 |
Source: Public Records
Map
Nearby Homes
- 1707 Westmoreland St
- 1715 Maxwell Ct
- 1713 Rupert St
- 7000 Tyndale St
- 6930 Southridge Dr
- 1566B Westmoreland St
- 6816 Dean Dr
- 1605 Dunterry Place
- 7103 Westbury Rd
- 1600 Chain Bridge Rd
- 1608 Chain Bridge Rd
- 1616 Chain Bridge Rd
- 1620 Chain Bridge Rd
- 0 Chain Bridge Rd Pathfinder Ln Unit VAFX2293712
- 1622 Chain Bridge Rd
- 1626 Chain Bridge Rd
- 1530 Pathfinder Ln
- 7205 Bayside Ct
- 1528 Pathfinder Ln
- 7043 Liberty Ln
- 1626 Craig Ln
- 1624 Craig Ln
- 1627 Craig Ln
- 1622 Craig Ln
- 1625 Craig Ln
- 1623 Craig Ln
- 1620 Craig Ln
- 1621 Craig Ln
- 6914 Bonheim Ct
- 6912 Bonheim Ct
- 6916 Bonheim Ct
- 6910 Bonheim Ct
- 6905 Rosemont Dr
- 6908 Bonheim Ct
- 1626 Westmoreland St
- 6918 Bonheim Ct
- 1618 Craig Ln
- 1633 Davidson Rd
- 6907 Rosemont Dr
- 6903 Rosemont Dr
Your Personal Tour Guide
Ask me questions while you tour the home.