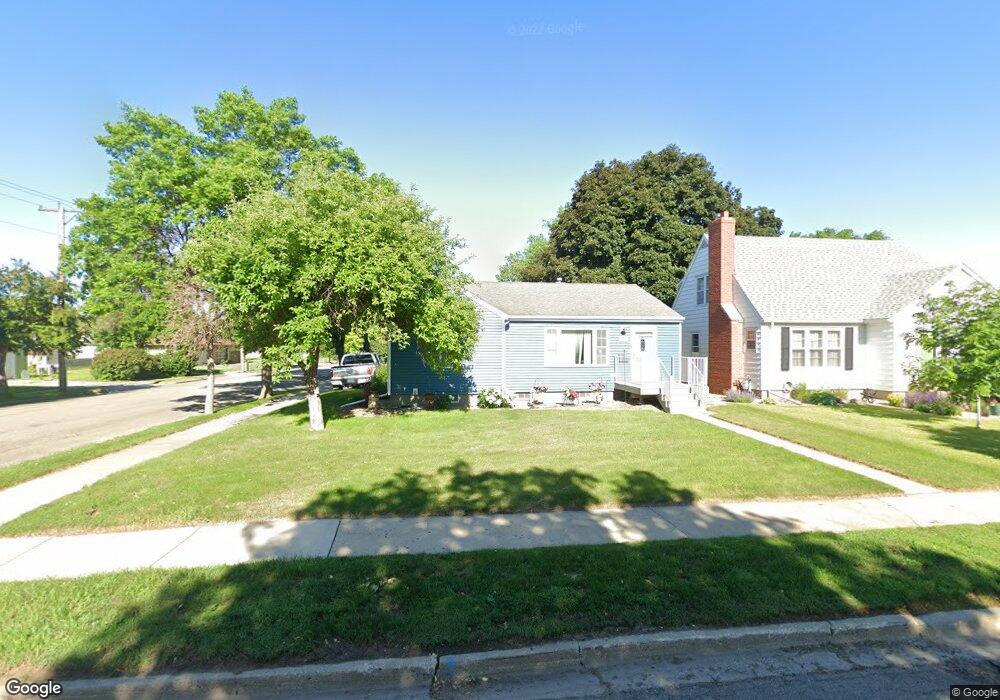
1628 S 3rd St Aberdeen, SD 57401
Estimated Value: $180,350 - $213,000
3
Beds
--
Bath
1,034
Sq Ft
$190/Sq Ft
Est. Value
About This Home
This home is located at 1628 S 3rd St, Aberdeen, SD 57401 and is currently estimated at $196,338, approximately $189 per square foot. 1628 S 3rd St is a home with nearby schools including Simmons Elementary School, Simmons Middle School, and Central High School.
Ownership History
Date
Name
Owned For
Owner Type
Purchase Details
Closed on
Jun 24, 2010
Sold by
Weekly James Mathew
Bought by
Delzer Bryan S
Current Estimated Value
Home Financials for this Owner
Home Financials are based on the most recent Mortgage that was taken out on this home.
Original Mortgage
$89,121
Outstanding Balance
$59,729
Interest Rate
4.97%
Mortgage Type
FHA
Estimated Equity
$136,609
Purchase Details
Closed on
Feb 22, 2006
Sold by
Federal National Mortgage Association
Bought by
Weekly James Mathew
Home Financials for this Owner
Home Financials are based on the most recent Mortgage that was taken out on this home.
Original Mortgage
$85,000
Interest Rate
6.33%
Mortgage Type
Unknown
Purchase Details
Closed on
Nov 29, 2005
Sold by
Delzer Bryan S and Delzer Michelle L
Bought by
Tcf Mortgage Corporation
Purchase Details
Closed on
May 18, 2005
Sold by
Tcf Mortgage Corproation
Bought by
The Federal National Mortgage Associatio
Create a Home Valuation Report for This Property
The Home Valuation Report is an in-depth analysis detailing your home's value as well as a comparison with similar homes in the area
Home Values in the Area
Average Home Value in this Area
Purchase History
| Date | Buyer | Sale Price | Title Company |
|---|---|---|---|
| Delzer Bryan S | $79,000 | None Available | |
| Weekly James Mathew | -- | None Available | |
| Tcf Mortgage Corporation | $78,687 | None Available | |
| The Federal National Mortgage Associatio | -- | None Available |
Source: Public Records
Mortgage History
| Date | Status | Borrower | Loan Amount |
|---|---|---|---|
| Open | Delzer Bryan S | $89,121 | |
| Previous Owner | Weekly James Mathew | $85,000 |
Source: Public Records
Tax History
| Year | Tax Paid | Tax Assessment Tax Assessment Total Assessment is a certain percentage of the fair market value that is determined by local assessors to be the total taxable value of land and additions on the property. | Land | Improvement |
|---|---|---|---|---|
| 2025 | $2,734 | $176,004 | $17,500 | $158,504 |
| 2024 | $2,649 | $160,540 | $17,500 | $143,040 |
| 2023 | $2,522 | $160,540 | $17,500 | $143,040 |
| 2022 | $2,525 | $144,647 | $17,500 | $127,147 |
| 2021 | $2,258 | $141,241 | $17,500 | $123,741 |
| 2020 | $2,159 | $124,910 | $17,500 | $107,410 |
| 2019 | $2,188 | $120,894 | $17,500 | $103,394 |
| 2018 | $2,048 | $120,894 | $17,500 | $103,394 |
| 2017 | -- | $117,883 | $17,500 | $100,383 |
| 2016 | -- | $115,875 | $0 | $115,875 |
| 2015 | -- | $115,875 | $0 | $115,875 |
| 2014 | -- | $109,190 | $0 | $109,190 |
| 2011 | -- | $99,828 | $0 | $0 |
Source: Public Records
Map
Nearby Homes
- 118 Church Dr
- 1423 S 1st St
- 1301 S 1st St
- 117 Elizabeth Dr
- 127 Elizabeth Dr
- 1202 S 1st St
- 1533 S Grant St
- 1022 17th Ave SW
- 2123 W Melgaard Rd
- 916 S 1st St
- 322 9th Ave SW
- 915 S 9th St
- 810 S 1st St
- 201 8th Ave SW
- 910 S Washington St
- 814 S 8th St
- 114 8th Ave SW
- 931 S Kline St
- 614 S 1st St
- 307 6th Ave SW
Your Personal Tour Guide
Ask me questions while you tour the home.