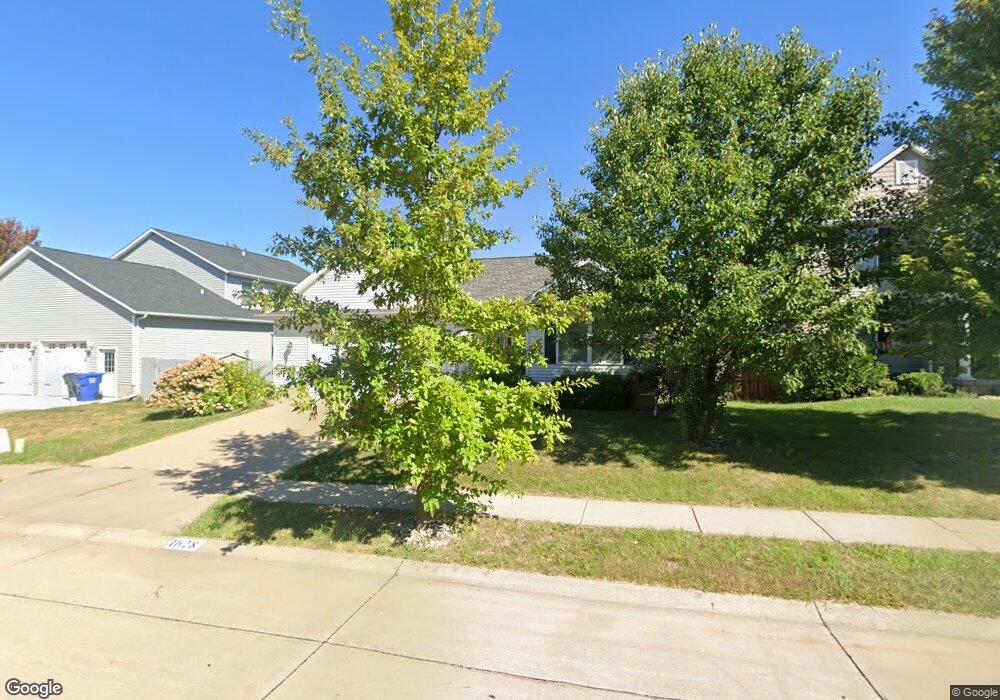
1628 W 69th St Davenport, IA 52806
North Side NeighborhoodEstimated Value: $344,000 - $358,546
3
Beds
3
Baths
1,475
Sq Ft
$238/Sq Ft
Est. Value
About This Home
This home is located at 1628 W 69th St, Davenport, IA 52806 and is currently estimated at $351,137, approximately $238 per square foot. 1628 W 69th St is a home located in Scott County with nearby schools including Cumberland Hall School, Academy Of Continuing Education, and Wood Intermediate School.
Ownership History
Date
Name
Owned For
Owner Type
Purchase Details
Closed on
Apr 26, 2010
Sold by
Mbdp Properties Lc
Bought by
Benbow Brian D
Current Estimated Value
Purchase Details
Closed on
Jun 16, 2009
Sold by
Mvp Development Llc
Bought by
Mbdp Properties Llc
Home Financials for this Owner
Home Financials are based on the most recent Mortgage that was taken out on this home.
Original Mortgage
$184,148
Interest Rate
4.86%
Mortgage Type
Construction
Create a Home Valuation Report for This Property
The Home Valuation Report is an in-depth analysis detailing your home's value as well as a comparison with similar homes in the area
Home Values in the Area
Average Home Value in this Area
Purchase History
| Date | Buyer | Sale Price | Title Company |
|---|---|---|---|
| Benbow Brian D | $262,000 | None Available | |
| Mbdp Properties Llc | $40,000 | None Available |
Source: Public Records
Mortgage History
| Date | Status | Borrower | Loan Amount |
|---|---|---|---|
| Previous Owner | Mbdp Properties Llc | $184,148 |
Source: Public Records
Tax History Compared to Growth
Tax History
| Year | Tax Paid | Tax Assessment Tax Assessment Total Assessment is a certain percentage of the fair market value that is determined by local assessors to be the total taxable value of land and additions on the property. | Land | Improvement |
|---|---|---|---|---|
| 2025 | $6,083 | $336,500 | $47,120 | $289,380 |
| 2024 | $5,767 | $300,770 | $47,120 | $253,650 |
| 2023 | $665 | $300,770 | $47,120 | $253,650 |
| 2022 | $1,082 | $268,400 | $40,620 | $227,780 |
| 2021 | $5,658 | $263,700 | $40,620 | $223,080 |
| 2020 | $5,924 | $256,660 | $40,620 | $216,040 |
| 2019 | $5,919 | $240,220 | $40,620 | $199,600 |
| 2018 | $5,432 | $240,220 | $40,620 | $199,600 |
| 2017 | $5,930 | $240,220 | $40,620 | $199,600 |
| 2016 | $5,539 | $240,220 | $0 | $0 |
| 2015 | $5,457 | $237,140 | $0 | $0 |
| 2014 | $5,266 | $237,140 | $0 | $0 |
| 2013 | $5,176 | $0 | $0 | $0 |
| 2012 | -- | $218,600 | $36,980 | $181,620 |
Source: Public Records
Map
Nearby Homes
- 1724 W 69th St
- Lot 65 W 66th St
- 000 Pacific St
- 2012 W 68th St
- SEQ - Division W 76th St
- SWQ - Division W 76th St
- Division St N & W 76th St
- 2110 W 68th St
- 6504 Cedar St
- 1301 W 62nd Ct
- 2113 W 75th Place
- 1415 W 59th St
- 5803 Fillmore Ln
- 2714 W 66th St
- Lot 26 Benjamin Ct
- 5735 Taylor St
- LOT 54 Franklin Ave
- Lot 56 Franklin Ave
- 5721 Taylor St
- 6308 Appomattox Rd
- 1620 W 69th St
- 6911 Madison St
- 1629 W 71st St
- 1633 W 71st St
- 1619 W 69th St
- 1635 W 69th St
- 1621 W 71st St
- 1611 W 69th St
- 6910 Madison St
- 6904 Madison St
- 6916 Madison St
- 1617 W 71st St
- 6830 Madison St
- 7101 Madison St
- 1628 W 71st St
- 6822 Madison St
- 1626 W 68th St
- 1632 W 68th St
- 1618 W 68th St
- 1610 W 68th St