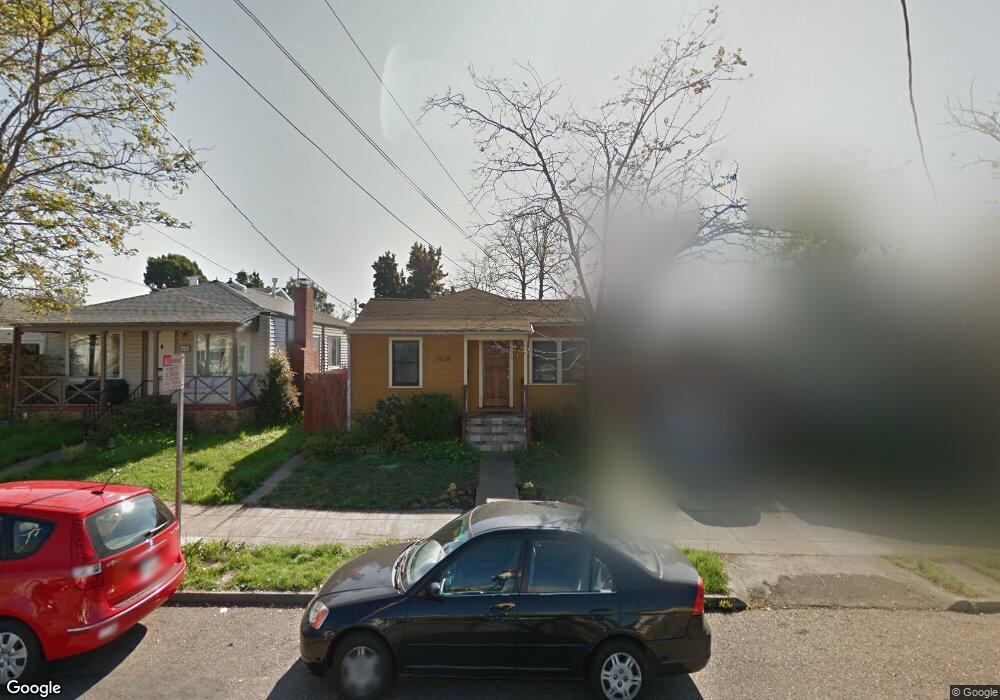
1628 Ward St Berkeley, CA 94703
South Berkeley NeighborhoodEstimated Value: $1,104,000 - $1,555,000
3
Beds
2
Baths
1,286
Sq Ft
$1,063/Sq Ft
Est. Value
About This Home
This home is located at 1628 Ward St, Berkeley, CA 94703 and is currently estimated at $1,366,888, approximately $1,062 per square foot. 1628 Ward St is a home located in Alameda County with nearby schools including Malcolm X Elementary School, Washington Elementary School, and Oxford Elementary School.
Ownership History
Date
Name
Owned For
Owner Type
Purchase Details
Closed on
Feb 10, 2014
Sold by
Jacobowitz David G and Keller Ann C
Bought by
The Kellobowitz Family Trust
Current Estimated Value
Purchase Details
Closed on
Jan 5, 2012
Sold by
Gittelsohn Michael
Bought by
Jacobowitz David G and Keller Ann C
Home Financials for this Owner
Home Financials are based on the most recent Mortgage that was taken out on this home.
Original Mortgage
$472,800
Outstanding Balance
$323,362
Interest Rate
3.93%
Mortgage Type
New Conventional
Estimated Equity
$1,043,526
Create a Home Valuation Report for This Property
The Home Valuation Report is an in-depth analysis detailing your home's value as well as a comparison with similar homes in the area
Home Values in the Area
Average Home Value in this Area
Purchase History
| Date | Buyer | Sale Price | Title Company |
|---|---|---|---|
| The Kellobowitz Family Trust | -- | None Available | |
| Jacobowitz David G | $591,000 | Old Republic Title Company |
Source: Public Records
Mortgage History
| Date | Status | Borrower | Loan Amount |
|---|---|---|---|
| Open | Jacobowitz David G | $472,800 |
Source: Public Records
Tax History
| Year | Tax Paid | Tax Assessment Tax Assessment Total Assessment is a certain percentage of the fair market value that is determined by local assessors to be the total taxable value of land and additions on the property. | Land | Improvement |
|---|---|---|---|---|
| 2025 | $11,105 | $735,290 | $222,687 | $519,603 |
| 2024 | $11,105 | $720,738 | $218,321 | $509,417 |
| 2023 | $10,872 | $713,472 | $214,041 | $499,431 |
| 2022 | $10,679 | $692,483 | $209,845 | $489,638 |
| 2021 | $10,704 | $678,771 | $205,731 | $480,040 |
| 2020 | $10,159 | $678,745 | $203,623 | $475,122 |
| 2019 | $9,787 | $665,441 | $199,632 | $465,809 |
| 2018 | $9,625 | $652,398 | $195,719 | $456,679 |
| 2017 | $9,278 | $639,608 | $191,882 | $447,726 |
| 2016 | $8,997 | $627,068 | $188,120 | $438,948 |
| 2015 | $8,878 | $617,653 | $185,296 | $432,357 |
| 2014 | $8,772 | $605,555 | $181,666 | $423,889 |
Source: Public Records
Map
Nearby Homes
- 2829 California St
- 2701 Grant St
- 1515 Derby St
- 2750 Sacramento St
- 1612 Parker St
- 2782 Sacramento St
- 2774 Sacramento St
- 2790 Sacramento St
- 2758 Sacramento St
- 1450 Ward St
- 1726 Parker St Unit 2
- 1726 Parker St Unit 1
- 2926 Ellis St
- 1634 Blake St
- 1819 Carleton St
- 1538 Ashby Ave
- 1524 Blake St
- 2533 Grant St
- 1516 Blake St
- 1516 Blake St Unit A
Your Personal Tour Guide
Ask me questions while you tour the home.