16287 Miramar Place Unit 10 San Leandro, CA 94578
West Castro Valley NeighborhoodEstimated Value: $625,000 - $723,000
3
Beds
3
Baths
1,525
Sq Ft
$445/Sq Ft
Est. Value
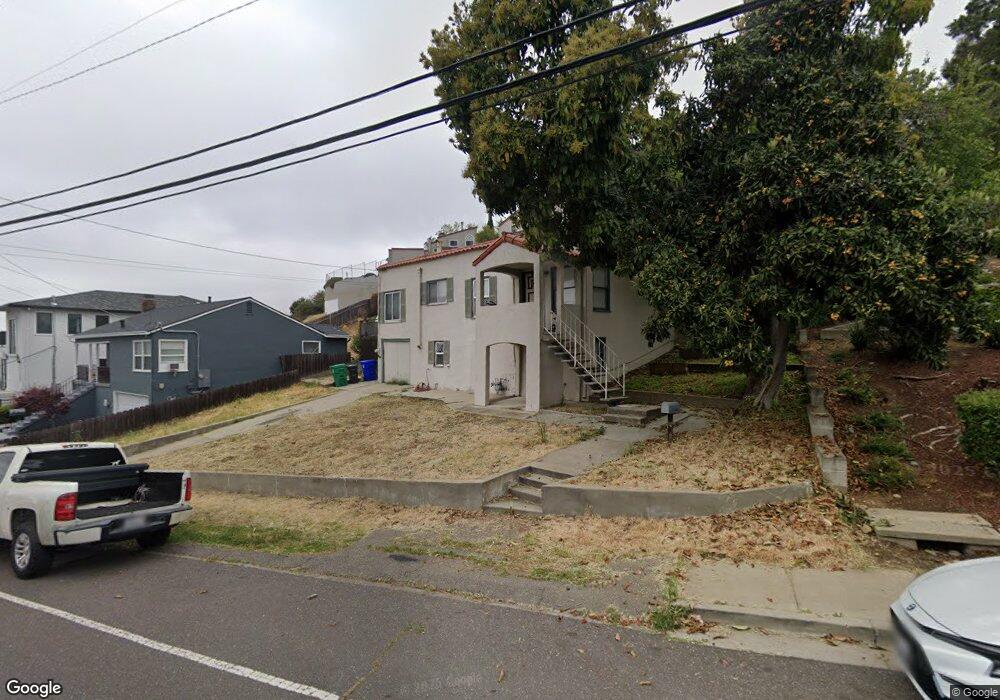
About This Home
This home is located at 16287 Miramar Place Unit 10, San Leandro, CA 94578 and is currently estimated at $678,903, approximately $445 per square foot. 16287 Miramar Place Unit 10 is a home located in Alameda County with nearby schools including Corvallis Elementary School, Edendale Middle, and San Lorenzo High School.
Ownership History
Date
Name
Owned For
Owner Type
Purchase Details
Closed on
Aug 25, 2015
Sold by
Uzozle Rosemary Uzoamaka
Bought by
Uzozle Rosemary U
Current Estimated Value
Purchase Details
Closed on
Aug 19, 2013
Sold by
Alburo Anthony and Aroma Abigail
Bought by
Uzozie Rosemary Uzoamaka
Home Financials for this Owner
Home Financials are based on the most recent Mortgage that was taken out on this home.
Original Mortgage
$351,500
Outstanding Balance
$262,645
Interest Rate
4.51%
Mortgage Type
New Conventional
Estimated Equity
$416,258
Purchase Details
Closed on
Jul 23, 2003
Sold by
Procita John C and Procita Patricia S
Bought by
Alburo Anthony and Aroma Abigail
Home Financials for this Owner
Home Financials are based on the most recent Mortgage that was taken out on this home.
Original Mortgage
$346,750
Interest Rate
5.17%
Mortgage Type
Purchase Money Mortgage
Create a Home Valuation Report for This Property
The Home Valuation Report is an in-depth analysis detailing your home's value as well as a comparison with similar homes in the area
Home Values in the Area
Average Home Value in this Area
Purchase History
| Date | Buyer | Sale Price | Title Company |
|---|---|---|---|
| Uzozle Rosemary U | -- | North American Title Co Inc | |
| Uzozie Rosemary Uzoamaka | $370,000 | Placer Title Company | |
| Uzozie Rosemary Uzoamaka | -- | Placer Title Company | |
| Alburo Anthony | $365,000 | North American Title Company |
Source: Public Records
Mortgage History
| Date | Status | Borrower | Loan Amount |
|---|---|---|---|
| Open | Uzozie Rosemary Uzoamaka | $351,500 | |
| Previous Owner | Alburo Anthony | $346,750 |
Source: Public Records
Tax History Compared to Growth
Tax History
| Year | Tax Paid | Tax Assessment Tax Assessment Total Assessment is a certain percentage of the fair market value that is determined by local assessors to be the total taxable value of land and additions on the property. | Land | Improvement |
|---|---|---|---|---|
| 2025 | $6,019 | $446,548 | $136,064 | $317,484 |
| 2024 | $6,019 | $437,658 | $133,397 | $311,261 |
| 2023 | $5,993 | $435,940 | $130,782 | $305,158 |
| 2022 | $5,900 | $420,394 | $128,218 | $299,176 |
| 2021 | $5,737 | $412,017 | $125,705 | $293,312 |
| 2020 | $5,611 | $414,721 | $124,416 | $290,305 |
| 2019 | $5,584 | $406,592 | $121,977 | $284,615 |
| 2018 | $5,315 | $398,622 | $119,586 | $279,036 |
| 2017 | $4,968 | $390,808 | $117,242 | $273,566 |
| 2016 | $4,791 | $383,145 | $114,943 | $268,202 |
| 2015 | $4,686 | $377,391 | $113,217 | $264,174 |
| 2014 | $4,616 | $370,000 | $111,000 | $259,000 |
Source: Public Records
Map
Nearby Homes
- 16274 San Remo Dr
- 2317 Prosperity Way
- 16411 Saratoga St Unit 106W
- 0 Miramonte Ave Unit 41107168
- 0 Miramonte Corner Saratoga Unit 41091854
- 2500 Miramar Ave Unit 203
- 2500 Miramar Ave Unit 101
- 2505 Miramar Ave Unit 122
- 16504 Page St
- 2250 Strang Ave
- 0 Lindview Dr
- 16520 Page St
- 16526 Page St
- 16560 Cowell St
- 16265 Lyle St
- 2081 Strang Ave
- 16543 Hannah Dr
- 19100 Crest Ave Unit 30
- 19100 Crest Ave Unit 23
- 19100 Crest Ave Unit 100
- 16283 Miramar Place
- 16279 Miramar Place Unit 8
- 16291 Miramar Place
- 16295 Miramar Place
- 16275 Miramar Place Unit 7
- 16297 San Remo Dr
- 16271 Miramar Place Unit 6
- 16267 Miramar Place
- 16289 San Remo Dr
- 16263 Miramar Place
- 16300 Miramar Place Unit 1
- 16258 Miramar Place
- 16254 Miramar Place Unit 22
- 16259 Miramar Place
- 16281 San Remo Dr
- 16290 San Remo Dr
- 16255 Miramar Place
- 16316 Miramar Place
- 16304 Saratoga St Unit D
- 16304 Saratoga St